BIOL368/F14:Nicole Anguiano Week 9
From OpenWetWare
Jump to navigationJump to search
HIV Structure Project
Presentation Link
HIV Structure Project Presentation
Question
How does the structure of the V3 protein region affect the HIV status (diagnosed, progressing or non-trending) of the patient?
Hypothesis
We hypothesize that diagnosed groups will express greater variability in the V3 region in their protein structure, in comparison to the non-trending groups. Initial comparisons show that diagnosed groups and progressing groups expressed greater genetic variability than non-trending groups. These changes may affect the third variable region, affecting the host's ability to adapt to the changes and generate sufficient immune response.
Subject Data
- The project will be done using the following sequences (the txt file containing all of the relevant amino acid sequences is linked to the name of the progressor group):
| Group | Subject | Visit | Sequences |
|---|---|---|---|
| AIDS Diagnosed | 3 10 15 |
1 6 1 6 1 4 |
1, 2, 4 3, 4, 5 3, 6, 7 2, 4, 8 2, 3, 4 5, 8, 10 |
| AIDS Progressing | 7 8 14 |
1 5 1 7 1 9 |
2, 3, 9 2, 8, 9 1, 4, 5 1, 6, 7 2, 3, 4 9, 10, 11 |
| No Trend | 5 6 13 |
1 5 1 9 1 5 |
1, 3, 8 4, 5, 2 1, 2, 3 6, 7, 9 1, 3, 4 3, 5, 4 |
- For more detail on the subjects, see week 8.
- The amino acid sequences were obtained from the Bedrock HIV Problem Space.
Results and Methods
Obtaining the Protein Sequences
- On this page, I will be specifically examining the protein sequences from the AIDS diagnosed patients, subject 3, subject 10, and subject 15. For an analysis of the AIDS Progressing patients, see Isabel Gonzaga's electronic lab notebook, and for an analysis of the No Trend patients, see Chloe Jone's electronic lab notebook.
- I obtained the amino acid sequences from the Bedrock HIV Problem space.
Multiple Sequence Alignment
- Then, I navigated to the Biology Workbench. I selected "Session Tools" and created a new session called "AIDS Diagnosed". Then I went to "Protein Tools" and hit "Add". I uploaded the file containing all of the amino acid sequences, then selected "Upload File".
- I selected all of the visit 1 clones and selected "ClustalW" and submitted it with the default settings. Then, I ran a ClustalW on all the final visit clones, and lastly I ran a ClustalW on all the clones over all the visits.
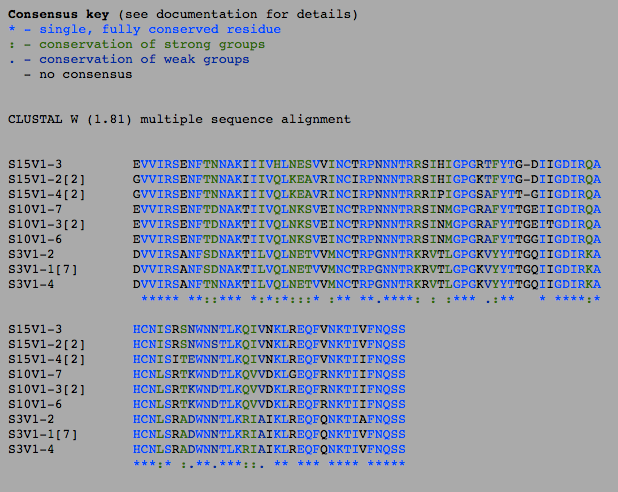
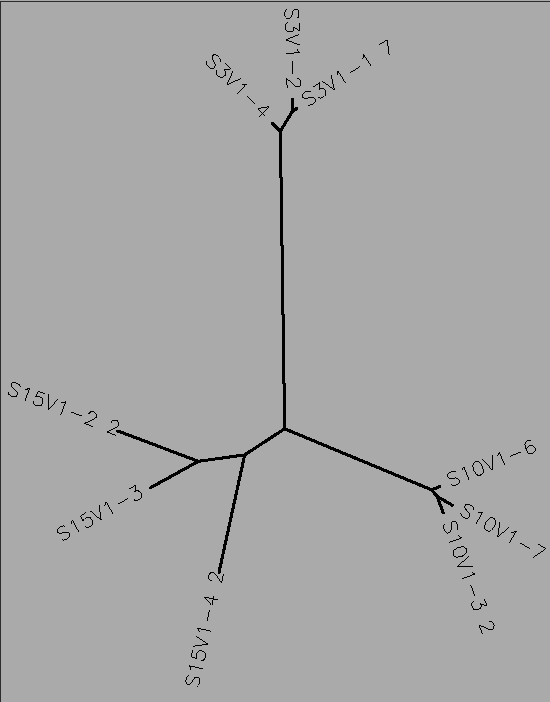
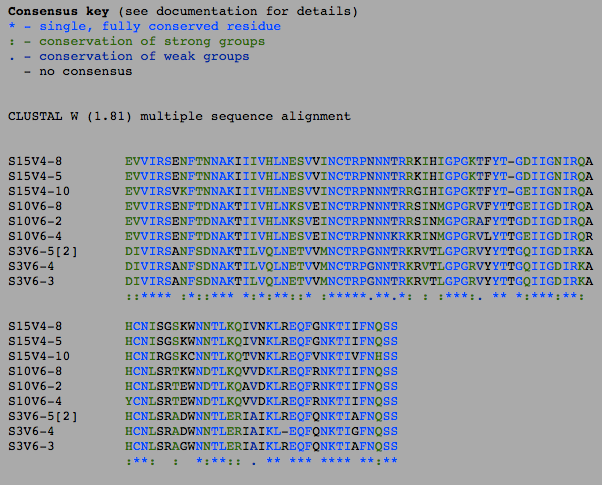
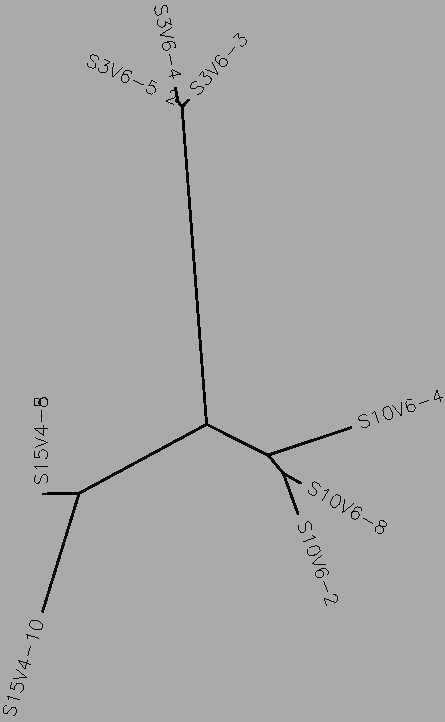
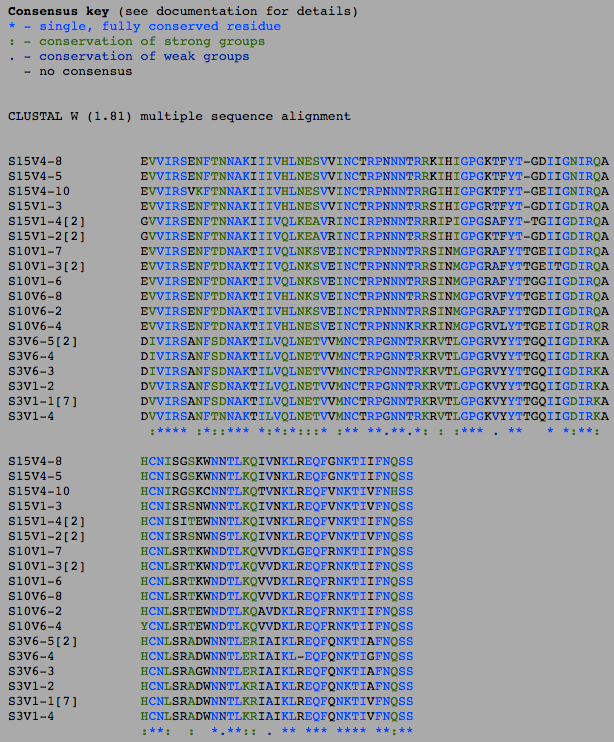
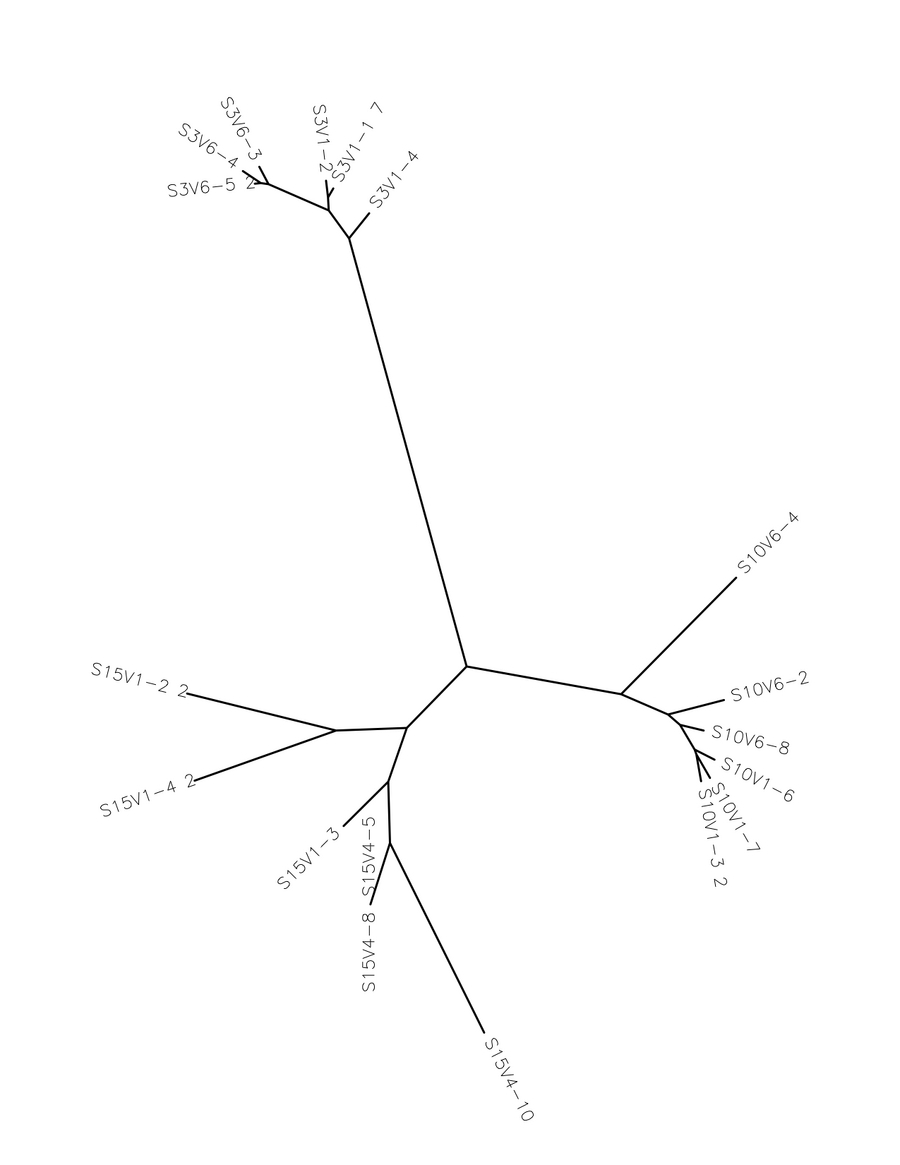
- The number of differences between the first and final visits increased, as expected (Table 1). The clones, though they diverged, remained most similar to the other clones in their particular groups. Overall, the clones are most similar to the clones in their own group, with the exception of Subject 15, visit 1, clone 3. This clone is more similar to the clones from the final visit for subject 15 than the first visit. This li
- Next, I switched to the "Nucleic Acid Tools". I uploaded the DNA sequences of the clones that correspond to the amino acid sequences. I then ran a clustalW on the first visit clones, the final visit clones, and then lastly all the clones to get a comparison of the number of differences between the amino acid sequences and the DNA sequences.
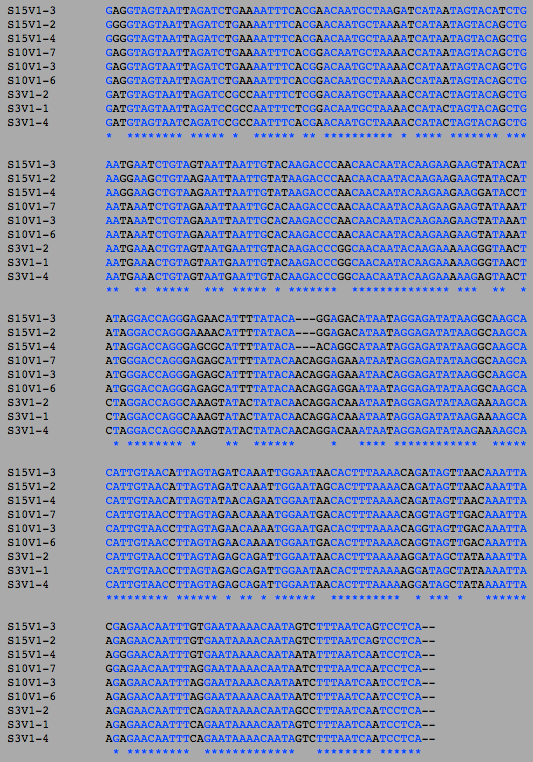
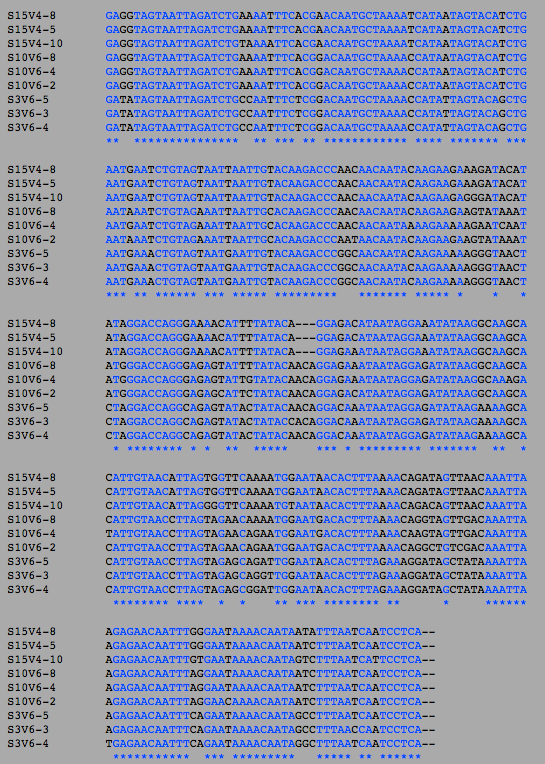
- Also as expected, the number of differences in the DNA sequence went up between the first and final visit.
| Visit | Type | Number of Differences | Percentage Different |
|---|---|---|---|
| 1 | Amino Acids | 37 | 37/95 = 38.9% |
| 1 | DNA | 69 | 69/285 = 24.2% |
| Final | Amino Acids | 45 | 45/95 = 47.3% |
| Final | DNA | 79 | 79/285 = 27.7% |
| Both | Amino Acids | 49 | 49/95 = 51.6% |
| Both | DNA | 94 | 94/285 = 33% |
- Table 1: Table illustrating the number of differences between the amino acid sequences and the DNA sequences at both visits.
- The increase between the visits in the amino acids was 8 (37 at the first visit and 45 at the second), and in the DNA it was 10 (69 in the first visit and 79 at the second), which is not a particularly large difference in increase. The overall percentage of Amino acids that are different is higher than the number of DNA nucleotides that are different, likely due to the fact that there are significantly more nucleotides than there are amino acids. A difference in a DNA sequence does not necessarily translate into a change into the amino acid sequence due to there being multiple codons for the same amino acid.
Secondary Structure Predictions
- Due to the nature of the question we wanted to ask, using PsiPred would be most applicable. PsiPred returns a result of the secondary structure, which is important to what we were asking in our question, as we wanted to see if the structure influenced the progressor groups.
- I went to the Biology Workbench, and performed a ClustalW on both visits of subject 3, then imported the alignment. I downloaded the alignment and inputted the result into PsiPred, then hit run. I repeated this with Subjects 10 and 15, then all of them at visit 1, then all of them at the final visit, then finally all together. Lastly, I ran PsiPred on the sequence in the full gp120 protein that corresponds to the region coded for by the clones of each subject.
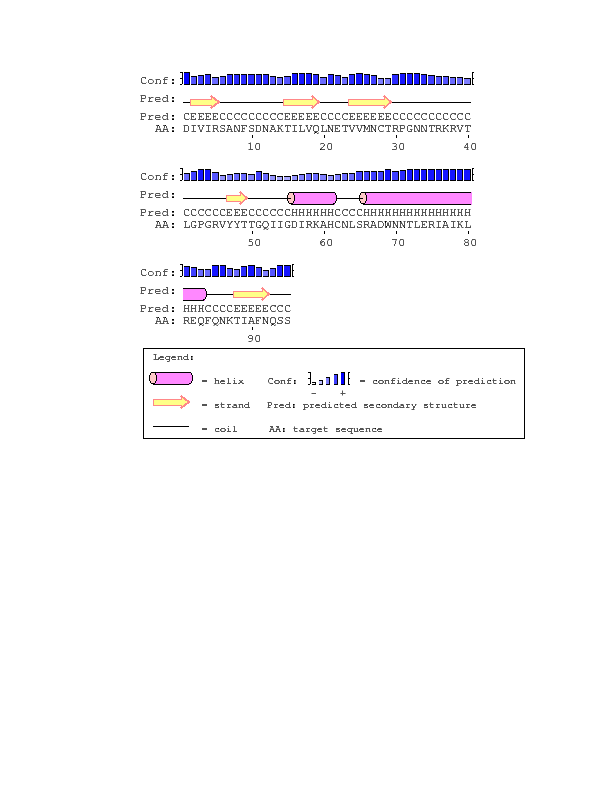
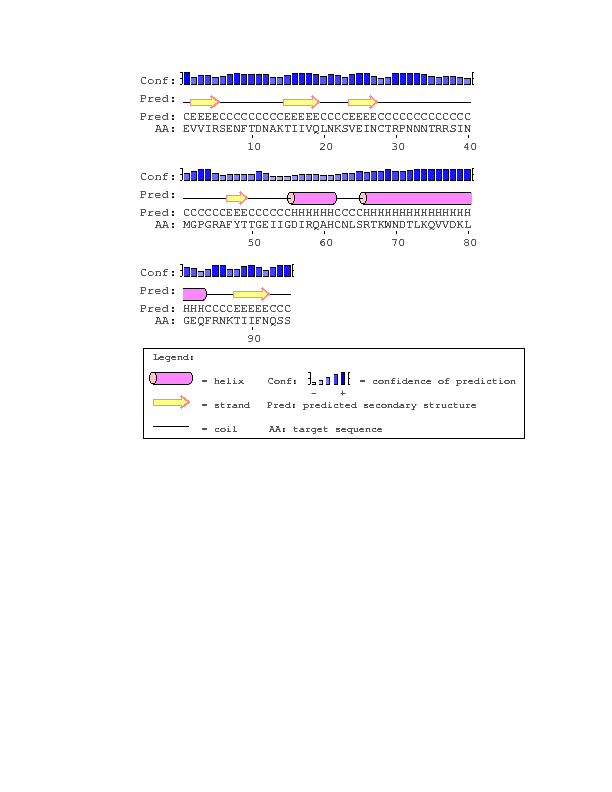
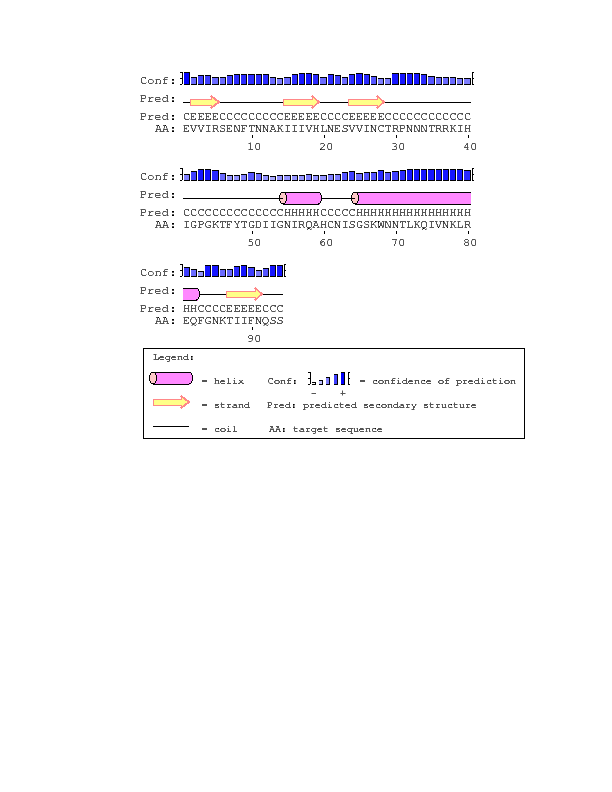
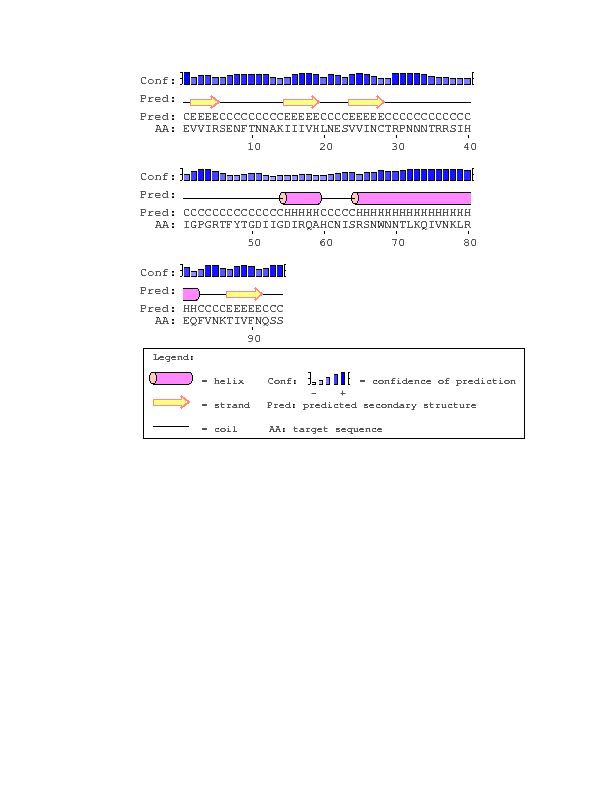
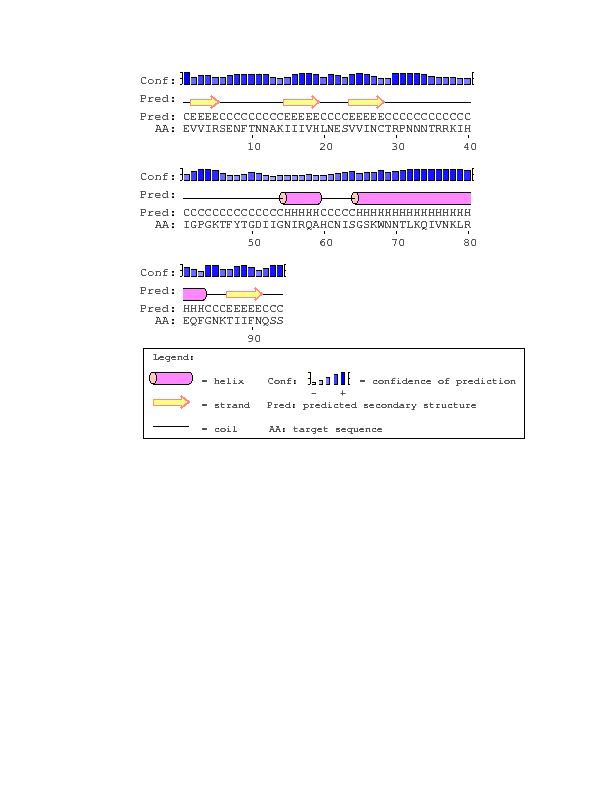
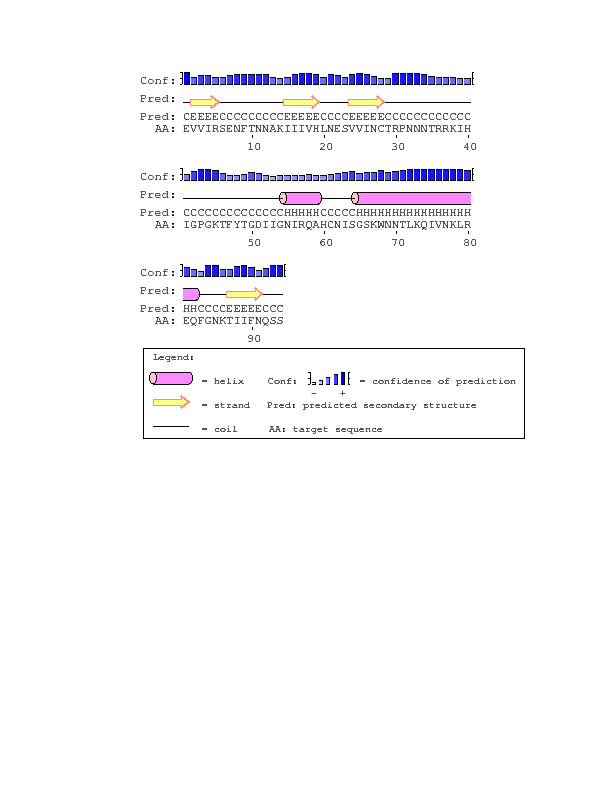
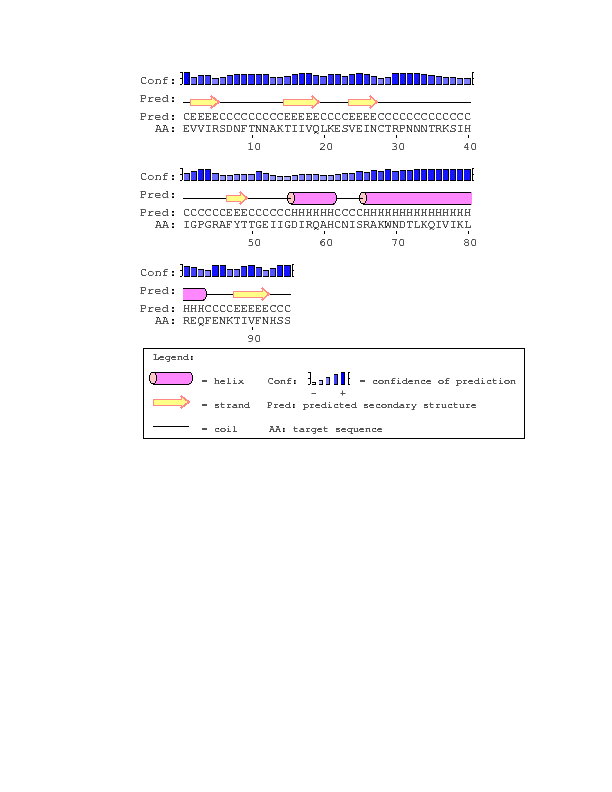
- With the exception of subject 15, each of the sequences matched the consensus sequence. Perhaps due to the influence of subject 15, the first and final visits results for all the sequences also are missing the beta sheet that subject 15 is missing.
gp120 Crystal Structure
- First I went to Huang et al. (2005) structure 2B4C and hit "View this Structure", and downloaded the file. Then, I opened it in Cn3D.
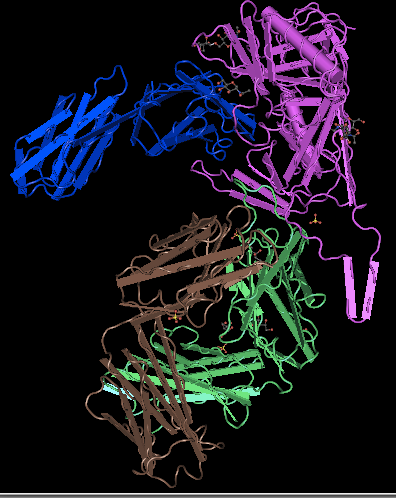
- To find the N and C-terminus of each polypeptide, I used the Sequence Viewer. The sequence viewer stated the beginning and end of each tertiary structure. There are 4 separate tertiary structures that make up the overall quaternary structure. They are known as the G, C, L, and H chains. I clicked the first and last amino acid of each one. The first would be the N-terminus, and the last would be the C-terminus (table 2).
| Chain | N-ter | C-ter |
|---|---|---|
| G | Valine | Glutamic acid |
| C | Lysine | Valine |
| L | Glutamic acid | Cysteine |
| H | Glutamine | Cysteine |
- Table 2: The N and C termini of each tertiary structure in gp120.
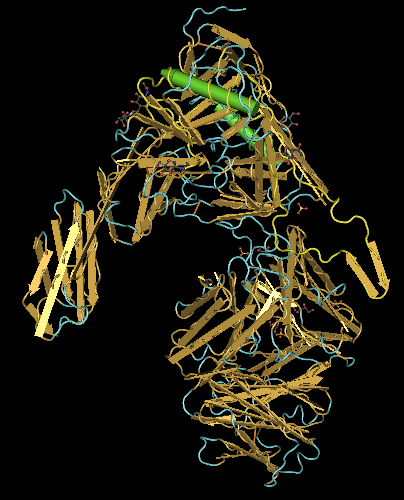
- Next, I selected "Style > Coloring Shortcuts > Secondary Structure". Then, in the Sequence/Alignment Viewer, I selected "EVVIRSDNFTNNAKTIIVQLKESVEINCTRPNNNTRKSIHIGPGRAFYTTGEIIGDIRQAHCNISRAKWNDTLKQIVIKLREQFENKTIVFNHSS" in the 2B4C_G row. This corresponds to the section coded for by the subject's clones (Fig. 18). After that, I selected "Select > Show Selected Residues" to show just that selection (Fig. 19).
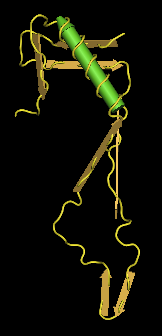
- The V3 base ends and becomes the gp120 protein at the disulfide bond between the antiparallel beta sheets. Looking at the structure above, I found the region in which there was the disulfide bond. I selected the regions that extended out from the bond and came back to it, which was "CTRPNQNTRKSIHIGPGRAFYTTGEIIGDIRQAHC". This region corresponds to the V3 region (Fig. 20).
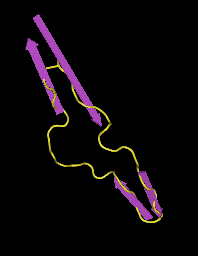
- The structure of V3 found and it's location, which is stated in Figures 10-16, does not match up to the official structure. Each of the PsiPred results shows an alpha helix towards the end, but it's clear that it should be a beta sheet. The reliability and confidence in the prediction at that location is low, which would likely explain the discrepancy.
Amino Acid Analysis
- The original sequence found by Huang, "CTRPNQNTRKSIHIGPGRAFYTTGEIIGDIRQAHC", has the following amino acid properties:
- Nonpolar (P, I, A, F, V, L, M): 10
- Uncharged Polar (C, T, N, S, G, Q, Y): 16
- Basic (R, K, H): 7
- Acidic (E, D): 2
- The sequence found in the subject 3 clones is "CTRPGNNTRKRVTLGPGRVYYTTGQIIGDIRKAHC". It has the following amino acid properties:
- Nonpolar (P, I, A, F, V, L, M): 9
- Uncharged Polar (C, T, N, S, G, Q, Y): 17
- Basic (R, K, H): 8
- Acidic (E, D): 1
- The sequence found in the subject 10 clones is "CTRPNNNTRRSINMGPGRAFYTTGEIIGDIRQAHC". It has the following amino acid properties:
- Nonpolar (P, I, A, F, V, L, M): 10
- Uncharged Polar (C, T, N, S, G, Q, Y): 17
- Basic (R, K, H): 6
- Acidic (E, D): 2
- The sequence found in the subject 15 clones is "CTRPNNNTRRKIHIGPGKTFYTGDIIGNIRQAHC". It has the following amino acid properties:
- Nonpolar (P, I, A, F, V, L, M): 9
- Uncharged Polar (C, T, N, S, G, Q, Y): 16
- Basic (R, K, H): 8
- Acidic (E, D): 1
- I think that it is possible that amino acid changes can affect the 3D structure. Especially in the case of Subject 15, who was missing an amino acid and as a result was missing the beta sheet, it is highly possible for changes in amino acid structure to cause changes to the structure. Because the V3 loop has regions that are highly conserved between regions with moderate to high amounts of diversity, I am not necessarily sure whether the 3D structure changes would be relevant in the V3 loop, with the exception of structure 15. If the changes take place in random coil, then it would not have a significant effect. There are several reasons within the protein that are highly conserved, and do not change, and I believe a change in those conserved regions would have a significant effect on 3D structure, but changes in other regions, while they may lead to changes in the 3D structure, may not lead to significant changes in the structure.
Links
Nicole Anguiano
BIOL 368, Fall 2014
Assignment Links
- Week 1 Assignment
- Week 2 Assignment
- Week 3 Assignment
- Week 4 Assignment
- Week 5 Assignment
- Week 6 Assignment
- Week 7 Assignment
- Week 8 Assignment
- Week 9 Assignment
- Week 10 Assignment
- Week 11 Assignment
- Week 12 Assignment
- Week 13 Assignment
- Week 15 Assignment
Individual Journals
- Individual Journal Week 2
- Individual Journal Week 3
- Individual Journal Week 4
- Individual Journal Week 5
- Individual Journal Week 6
- Individual Journal Week 7
- Individual Journal Week 8
- Individual Journal Week 9
- Individual Journal Week 10
- Individual Journal Week 11
- Individual Journal Week 12
- Individual Journal Week 13
- Individual Journal Week 15