BIOL368/F14:Chloe Jones Week 9
Defining Your HIV Structure Research Project
Project Partners: Isabel Gonzaga and Nicole Anguiano Chose to analyze Isabel's question into further detail, information below is taken from Isabel Gonzaga Week 8
Question
How does HIV status (diagnosed, progressing or non-trending) affect the structure of the V3 protein region?
Hypothesis
We hypothesize that diagnosed groups will express greater variability in the V3 region in their protein structure, in comparison to the non-trending groups. Initial comparisons show that diagnosed groups and progressing groups expressed greater genetic variability than non-trending groups. These changes may affect the third variable region, affecting the host's ability to adapt to the changes and generate sufficient immune response.
Subject Data
According to the BEDROCK HIV Sequence Data Table, I was able to determine which of the subjects used within my study actually developed aids. All 3 AIDS diagnosed were confirmed with the disease by their final visit. In the AIDS progressing groups, subjects developed AIDS within 1 year after their final visit. The Non-Trending groups all maintained high CD4 T Cell Counts above the threshold, even after the study was conducted. Sequences were for each visit and subject were chosen using a Random Integer Generator, to eliminate selection bias.
The following sequences was taken from the BEDROCK HIV Problem Space Database, from the Markham et al. (1998) study.
Table 1: Sequences analyzed
| Group | Subject | Visit | Sequences |
|---|---|---|---|
| AIDS Diagnosed | 3 10 15 |
1 6 1 6 1 4 |
1, 2, 4 3, 4, 5 3, 6, 7 2, 4, 8 2, 3, 4 5, 8, 10 |
| AIDS Progressing | 7 8 14 |
1 5 1 7 1 9 |
2, 3, 9 2, 8, 9 1, 4, 5 1, 6, 7 2, 3, 4 9, 10, 11 |
| No Trend | 5 6 13 |
1 5 1 9 1 5 |
1, 3, 8 4, 5, 2 1, 2, 3 6, 7, 9 1, 3, 4 3, 5, 4 |
Results and Methods
- For this group project we were each assigned a group with three subjects and three clones for each subject to be analyzed. Nicole Anguiano is working with the AIDS Diagnosed patients, Isabel Gonzaga is working with the AIDS Progressing patients, and on this page I will be working with the patients that have no trend, referred to as "No Trend."
- Convert DNA sequences into protein sequences:
- To convert the DNA sequences into Protein sequences, we could obtain the DNA sequences from BEDROCK HIV Problem Space Database, and then take the DNA sequences and code the nucleic acids into amino acids using the triplet code. The three nucleotide codon would encode one amino acid and not be time effective. Therefore, to do the job more efficiently we obtained the protein sequences from BEDROCK HIV Problem Space.
Multiple Sequence Alignment
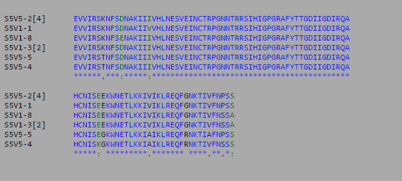
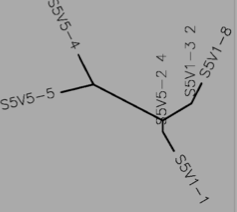
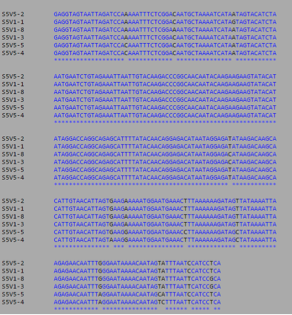
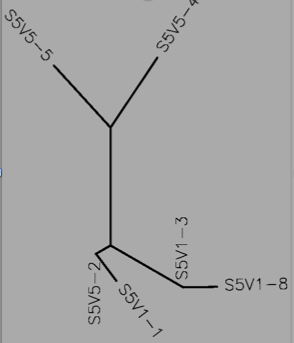
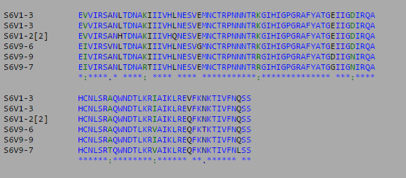
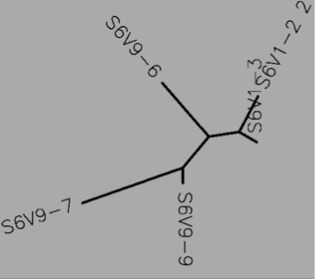
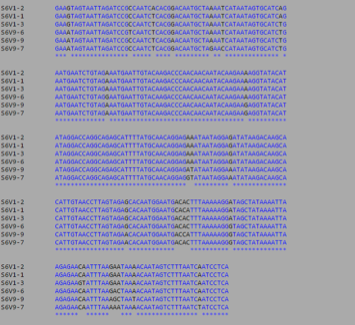
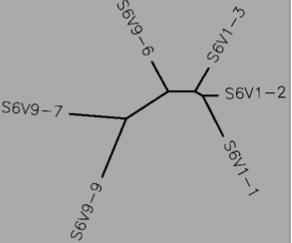
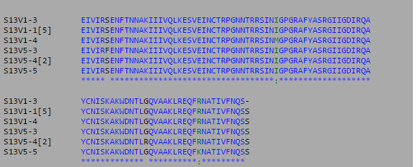
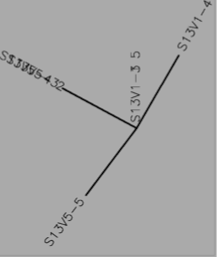
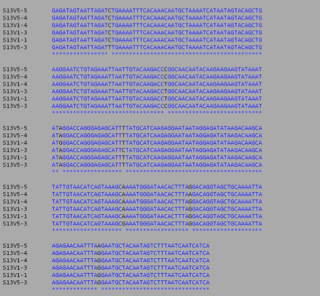
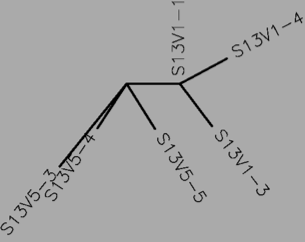
- Using Biology Workbench, I imputed the Amino Acid sequences in FASTA format into the program. To create multiple sequences alignment for proteins the “Protein tools” was selected. With the appropriate clones selected for Subjects 5, 6, and 13 I ran a ClustalW (multiple sequence alignment). I then ran it on all the subjects and the appropriate clones for the first visit, and the last visit. I followed the same procedure for the DNA sequences, however the “Nucleic Acid tool” was selected and DNA sequences were entered in FASTA format.
- Consensus Key
- *-single, fully conserved residue
- :-Conservation of strong groups
- .-Conservation of weak groups
- - no consensus
Subject 5
- Protein
- DNA
Subject 6
- Protein
- DNA
Subject 13
- Protein
- DNA
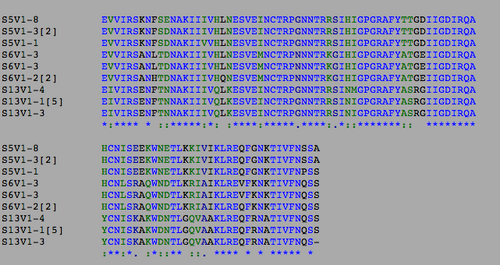
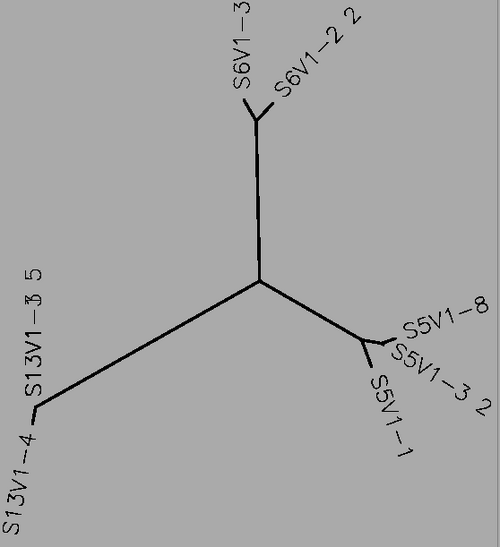
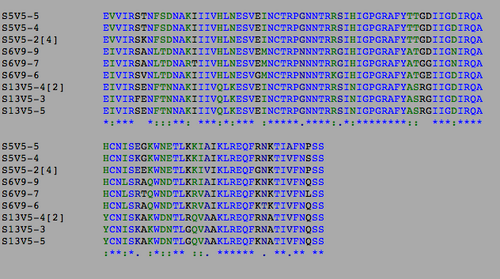
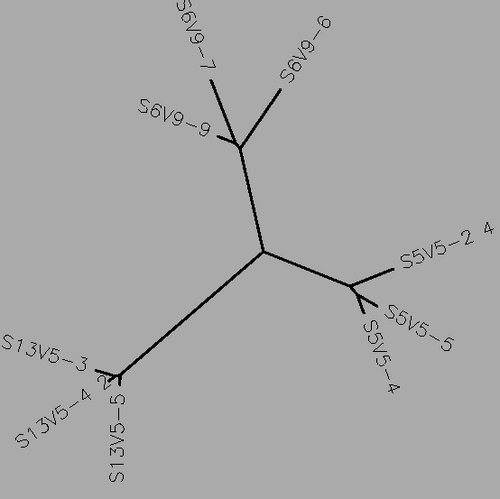
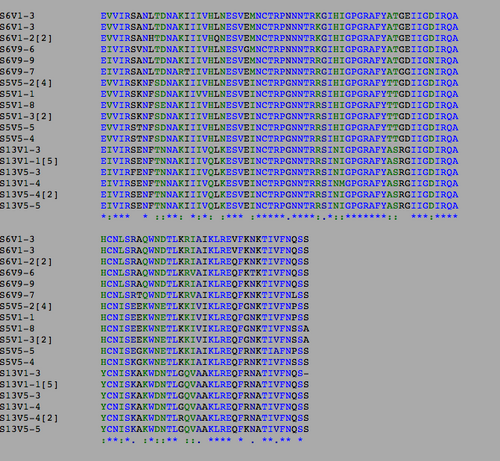
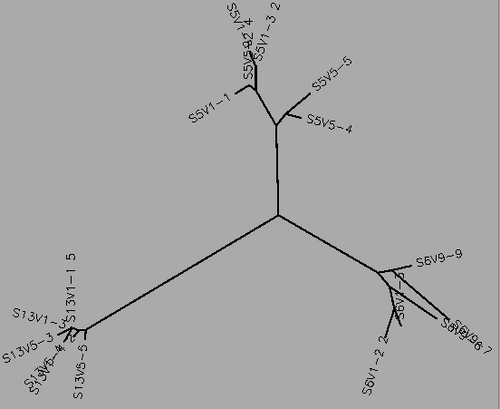
- Table 1:Showing the percent difference in the Protein Sequence and DNA Sequence for Subject 5,6,13 for the first visit, final visit, and all the visits.
| Visit | Type | Number of Differences | Percentage Different |
|---|---|---|---|
| 1 | Amino Acids | 36 | 36/95 = 37.9% |
| 1 | DNA | 67 | 67/285 = 23.5% |
| Final | Amino Acids | 38 | 38/95 = 40% |
| Final | DNA | 67 | 67/285 = 23.5% |
| Both | Amino Acids | 43 | 43/95 = 45.3% |
| Both | DNA | 79 | 79/ 285=27.7% |
- The percent difference remained relatively the same throughout the visits in regards to amino acid and DNA sequences. Indicative of a Non-progressor or Non-trending.
Locate V3 Region
- After reading the Huang et al. paper and giving the presentation I had some insight as the V3 region would look like on the gp120 protein. After downloading Huang et al. (2005) Structure 2B4C into StarBiochem and adjusting the size of atoms and secondary structure, I was able to obtain a clear picture of the V3 region on the protein.
- In StarBiochem, I selected import, then typed in the protein sequence 2B4C which is indicative of the Huang et al. protein presented in his paper
- The V3 region protrudes from the protein and can be identified by its loop and its adjacent beta sheets.
- In Figure. 20, the V3 region is highlighted with Star Biochem database tools. With the tools it has the ability to enlarge particular areas of interest, which in this case was the V3 region residues 296-331.
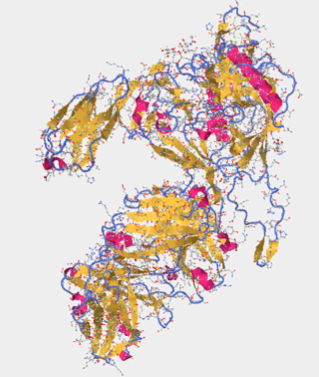
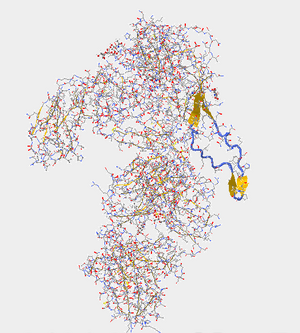
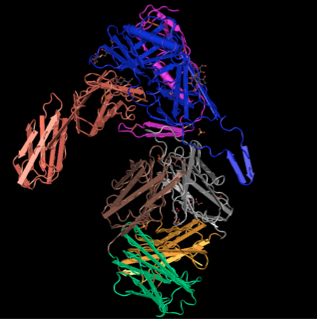
To determine the N-terminus and C-terminus I again used Star Biochem and clicked on the quaternary tab which broke the protein into 4 chains: Pink (chain c), Salmon (chain H), Green (Chain L), and Yellow (Chain G)
- Yellow (Chain G:84:G-492:G)
- N-terminus: [VAL]84:G
- C-terminus: [GLU]492;G
- Pink (Chain C:1:C-175:C)
- N-terminus: [LYS]1:C
- C-terminus: [VAL]175;C
- Green (Chain L:1:L- 214:L)
- N-terminus: [GLU]1:L
- C-terminus:[CYS]214:L
- Salmon(Chain 2:H -216:H)
- N-terminus: [GLN]2:H
- C-terminus: [CYS]216:H
V3 Amino Acid Properties
- Nonpolar: 12
- Polar: 11
- Positively charged: 6
- Negatively charged: 2
- Aromatic: 2
Secondary Structure Elements:
- Beta Sheets: 22
- Alpha Helices: 17
- Random Coil: 84
Secondary Structure Prediction on the V3 Fragment
The gp120 protein from Huang et al. was ran on PSIpred in order to predict secondary structures. The V3 region sequence was identified at residues 293 through 326. This was compared to the PSIPred's for the Markham et al. sequences. The amino acid for the Markham et al. sequences were identified from residues 29-63. In each of the PSIPred runs, a corresponding beta sheet and alpha helix exists, as expected. This shows that the proper portion of the Markham et al. sequences were identified as the V3 regions.
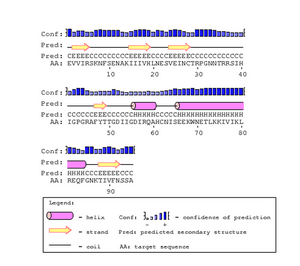
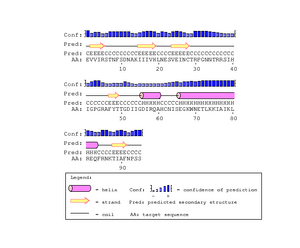
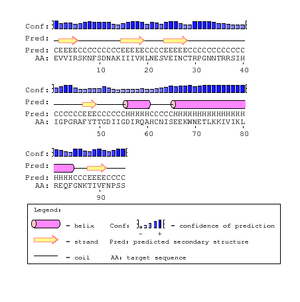
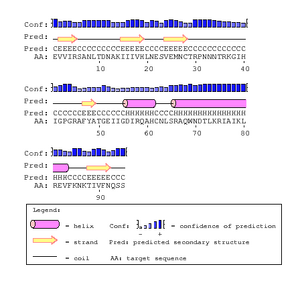
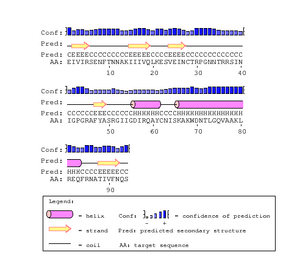
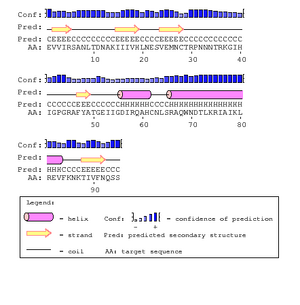
In Figure. 20 the V3 region is depicted as having two antiparallel beta sheets, however the PsiPred results predict that their is an helix at the end which leads us to believe that their is some discrepancy. However, the confidence level for the helix prediction is low and denoted by a lower bar in comparison to tbe beta sheets.
Presentation Link
HIV Structure Project Presentation
Electronic Lab Notebook
- Chloe Jones Week 2
- Chloe Jones Week 3
- Chloe Jones Week 4
- Chloe Jones Week 5
- Chloe Jones Week 6
- Chloe Jones Week 7
- Chloe Jones Week 8
- Chloe Jones Week 9
- Chloe Jones Week 10
- Chloe Jones Week 11
- Chloe Jones Week 12
- Chloe Jones Week 13
- Chloe Jones Week 15
Weekly Assignments
- Week 1 Assignment
- Week 2 Assignment
- Week 3 Assignment
- Week 4 Assignment
- Week 5 Assignment
- Week 6 Assignment
- Week 7 Assignment
- Week 8 Assignment
- Week 9 Assignment
- Week 10 Assignment
- Week 11 Assignment
- Week 12 Assignment
- Week 13 Assignment
- Week 15 Assignment
Class Journals
- Class Journal Week 1
- Class Journal Week 2
- Class Journal Week 3
- Class Journal Week 4
- Class Journal Week 5
- Class Journal Week 6
- Class Journal Week 7
- Class Journal Week 8
- Class Journal Week 9
- Class Journal Week 10
- Class Journal Week 11
- Class Journal Week 12
- Class Journal Week 13
- Class Journal Week 15
Chloe Jones 03:46, 15 October 2014 (EDT)Chloe Jones