Imperial College/Courses/Spring2008/Synthetic Biology/Computer Modelling Practicals/Practical 2
<html> <body> <script type="text/javascript"> var sc_project=3315875; var sc_invisible=0; var sc_partition=36; var sc_security="779debd0"; </script>
<script type="text/javascript" src="http://www.statcounter.com/counter/counter_xhtml.js"></script><noscript>
</noscript>
</body> </html>
Practical 2
Objectives:
- To explore computationally some simple genetic motifs:
- Synthesis Degradation Model
- Constitutive Gene Expression.
- Activated and Repressed Gene Expression.
- Positive and Negative Feedback Gene Expression.
Deliverables
- A report is expected.
- Instructors: Vincent Rouilly, Geoff Baldwin.
Part I: Synthesis-Degradation Model
In this section, we investigate a very common motif in biochemistry. It models the continuous and constant synthesis of a compound, and its natural degradation.
From a Mathematical point of view, the model is described as a first-order linear ordinary differential equation.
| Model | CellDesigner Instructions |
|---|---|
Build the topology of the reaction network
| |
From the law of mass action, we can write:
|
Define the kinetics driving the reaction network
|
| Simulate the dynamical behaviour |
|
- Questions:(see report structure)
- Run a simulation over t=1000s, nb points=1000. Comment on the time evolution of 'A'. (illustration needed).
- Using the dynamical system definition, what is the steady state level of 'A' with regards to the parameters k1 and k2 ? (Steady state means that [math]\displaystyle{ \frac{d[A]}{dt}=0 }[/math]
- Using the 'Parameter Scan' feature, illustrate the influence of both parameters (k_1 and k_2), on the steady state level of 'A' (illustration needed).
- Bonus: Give the analytical solution of the ODE system.
- Now, consider that k_1=0, and [math]\displaystyle{ [A]_{t=0}=A_{0} \gt 0 }[/math]. Keep k_2=0.01. Illustrate the concept of half-life for the compound 'A'.
- Check Derivation of the Half-life expression: exponential decay model
- Additional Resources:
Part II: Constitutive Gene Expression
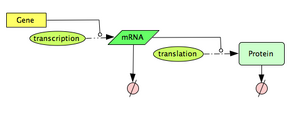
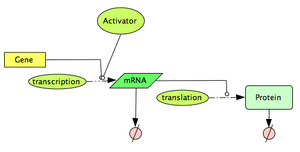
In this section, we explore a computational model to describe a constitutively expressed gene. The model is based on a simple interpretation of the central dogma: Gene -(transcription)-> mRNA -(translation)-> Protein, with both the mRNA molecules and the protein molecules being naturally degraded. If you need a quick refresh on the Central Dogma, have a look at the 'additional resources' section below.
The modelling parameters, used throughout this practical, are characteristic of the E.Coli bacteria.
| Model | CellDesigner Instructions |
|---|---|
|
|
Define the topology of the reaction network:
|
|
Following the law of mass action, we can write: |
|
Questions:
- From the ODE system given, write down the steady-state expression of the [mRNA] concentration and the [Protein] concentration, with regards to [math]\displaystyle{ k_1, k_2, d_1, d_2 }[/math]. Remember that steady-state means that we consider d[mRNA]/dt=0 and d[protein]/dt=0.
- Using the previously found equations, and knowing that average number of mRNA molecules per gene is 2.5 in E.Coli, what is the average transcription rate ? Keep in mind that the problem only gives the mRNA half life, not the actual degradation rate (see the exponential decay model for more info)
- In the same way, knowing that the average number of proteins per gene is 1000 in E.Coli, what is the average translation rate ? Once again, remember that the problem gives the protein half-life, and not the actual protein degradation rate.
- In CellDesigner, define all the necessary kinetics laws for the model, and create all the appropriate parameters.
- Run a simulation, and comment on the simulation outputs (mRNA and Protein), with regards to the transient phase and the steady-state.
- From a Synthetic Biology point of view, this motif can be seen as a 'Protein Generator'. One might be interested in controlling the steady-state protein output level of this device. Using the 'parameter scan' function, run a simple sensitivity analysis on each of the 4 parameters, within a 10% range of their default value. Illustrate, and describe briefly, how each parameter impacts the protein steady state.
Next, we want to explore the quasi-steady-state assumption on the mRNA molecules expression. From the previous simulations, you might have noticed that the concentration of mRNA reaches steady-state very quickly, compared to the protein concentration. In that case, we want to explore a model where we would consider that the [mRNA] concentration is always considered at steady state , i.e. [math]\displaystyle{ \frac{d[mRNA]}{dt}=0 }[/math] all the time. This model means that we want to apply a quasi-steady-state assumption on the [mRNA] molecules.
| Model | CellDesigner Instructions |
|---|---|
|
|
|
|
Following the law of mass action, we can write: |
|
Questions:
- Taking into account the quasi-steady-state assumption on the [mRNA], work-out the value of 's', and 'd' with regards to [math]\displaystyle{ k_1, k_2, d_1, d_2 }[/math], so that the two models are equivalent.
- Simulate the full model, alongside with the quasi-steady state approximation. When using the parameters from the previous section, comment on how good this approximation seems to be.
- Why do you think such a reduced model would be useful ?
Additional Resources:
- Central Dogma in Molecular Biology (from Wikipedia)
- Gene Expression (from Wikipedia)
- Steady-State in Chemistry
- E.Coli Statistics
Part III: Activated and Repressed Gene Expression
Very few genes are known to have a purely constitutive expression, most genes have their expression controlled by some outside signals (DNA-binding proteins, Temperature, metabolites, RNA molecules ...). In this section, we will particularly focus on the study of DNA-binding proteins, called transcription factors. These proteins, when binding to a promoter region, can either have an activation effect on the gene (positive control), or a repression effect (negative control). In prokaryotes, control of transcriptional initiation is considered to be the major point of regulation. In this part of the tutorial, we investigate one of the most common model used to describe this type of interactions.
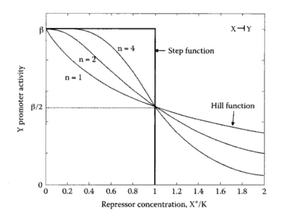
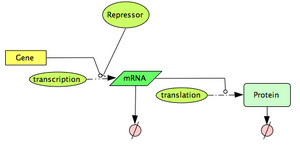
Let's first consider the case of a transcription factor acting as a repressor. A repressor will bind to the DNA so that it prevents the initiation of transcription. Typically, we expect the transcription rate to decrease as the concentration of repressor increases. A very useful family of functions to describe this effect is the Hill function:
[math]\displaystyle{ f(R)=\frac{\beta.{K_m}^n}{{K_m}^n+R^n} }[/math].
The Hill function can be derived from considering the transcription factor binding/unbinding to the promoter region to be at equilibrium (similar to the enzyme-substrate assumption in the Michaelis-Menten formula).
This function has 3 parameters: [math]\displaystyle{ \beta, n, K_m }[/math]:
- [math]\displaystyle{ \beta }[/math] is the maximal expression rate when there is no repressor, i.e. [math]\displaystyle{ f(R=0)=\beta }[/math].
- [math]\displaystyle{ K_m }[/math] is the repression coefficient (units of concentration), it is equal to the concentration of repressor needed to repressed by 50% the overall expression, i.e [math]\displaystyle{ f(K_m)=\frac{\beta}{2} }[/math]
- [math]\displaystyle{ n }[/math] is the Hill Coefficient. It controls the steepness of the switch between no-repression to full-repression.
| Model | CellDesigner Instructions |
|---|---|
|
|
Define the topology of the reaction network:
|
|
Hill function for transcriptional repression:
|
|
|
Following the law of mass action, we can write: |
|
Questions:
- We want to establish the transfer function between the [repressor] concentration and the protein steady-state level. To do so plot [math]\displaystyle{ [Protein]_{steady-state} = F([Repressor]) }[/math] using the results of the simulations where the repressor concentration varies from [0 to 1000] by steps of 10.
- Suggest an application where this genetic circuit might be useful.
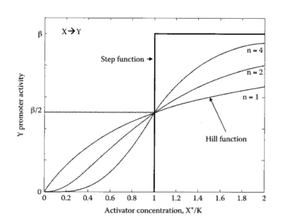
Now, let's consider the case of a transcription factor acting as an activator. An activator will bind to the DNA so that it promotes the initiation of transcription. Typically, we expect the transcription rate to increase as the concentration of activator increases. Once again, the Hill type function will be useful to describe the interaction effect. It is slightly different from the previous one: [math]\displaystyle{ f(R)=\frac{\beta.{A}^n}{{K_m}^n+A^n} }[/math].
The Hill function can be derived from considering the transcription factor binding/unbinding on the promoter region to be at equilibrium (similar to the enzyme-substrate assumption in the Michaelis-Menten formula).
This function has 3 parameters: [math]\displaystyle{ \beta, n, K_m }[/math]:
- [math]\displaystyle{ \beta }[/math] is the maximal expression rate when there is a lot of activators, i.e. [math]\displaystyle{ f(A \gg K_m)=\beta }[/math].
- K_m is the activation coefficient (units of concentration), it is equal to the concentration of activator needed to activate by 50% the overall expression, i.e [math]\displaystyle{ f(K_m)=\frac{\beta}{2} }[/math]
- [math]\displaystyle{ n }[/math] is the Hill Coefficient. It controls the steepness of the switch between no-repression to full-repression.
| Model | CellDesigner Instructions |
|---|---|
|
|
Define the topology of the reaction network:
|
|
Hill function for transcriptional activation:
|
|
|
Following the law of mass action, we can write: |
- We want to establish the transfer function between the [Activator] concentration and the protein steady-state level. To do so plot [math]\displaystyle{ [Protein]_{steady-state} = F([Activator]) }[/math] using the results of the simulations where the Activator concentration varies from [0 to 1000] by steps of 10.
- Suggest an application where this genetic circuit might be useful.
Additional Resources:
- Transcriptional Factors (from Wikipedia)
- Hill function simulator
- Hill Function (from Wikipedia)
- Book:"Introduction to Systems Biology", Uri Alon
Part IV: Positive and Negative Feedback
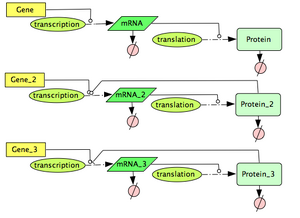
We have just seen that some genes can be controlled by DNA-binding proteins. This type of interactions will enable the construction of genetic networks, called transcription networks. One gene produces a protein, which then binds to one or more other genes, and control them (positively or negatively), and so on. During the practical 3, we will explore some of those circuits.
At the same time, it has been observed that some genes can also regulate themselves (positively or negatively). When a gene is regulated by the very same protein it produces, the motif is called a feedback. It can be a positive feedback, or a negative, depending on the type of interaction there is between the protein and the promoter region. In this section, we will explore those 2 options.
| Model | CellDesigner Instructions |
|---|---|
|
|
Questions:
- Provide the 3 ODE systems you need to describe the 3 different motifs:constitutive, negative feedback, and positive feedback.
- Create all the necessary kinetic laws considering the parameters as follow:
- Constitutive Expression: K_1=.346; d_1=.138 ; K_2=6.931 ; d_2=0.017 .
- Negative Feedback Expression: K_1=33.847 ; n=1; Km=10 ; d_1=.138 ; K_2=6.931 ; d_2=0.017
- Positive Feedback Expression: K_1=.346 ; n=1; Km=10 ; d_1=.138 ; K_2=6.931 ; d_2= 0.017
- Compare the different models with regards to their protein steady-state level, and also with regards to how fast each model is reaching its steady-state.
- Comment on the benefits and drawbacks of using a negative, or positive, feedback.


