IGEM:IMPERIAL/2009/M3
Module 3 - Genomic neutralisation
- People: Kun, Dineka and Royah
- This module is aimed at removing all the genetic material after encapsulation has taken place. This ensures that the bacteria is not harmful when injested and allays any genetically modified organism concerns.
- Module 3 consists of 4 sub sections:
1) Promoters
2) Thermoinduction
3) Killing mechanism
4) Dam Methylation
Genetic circuit
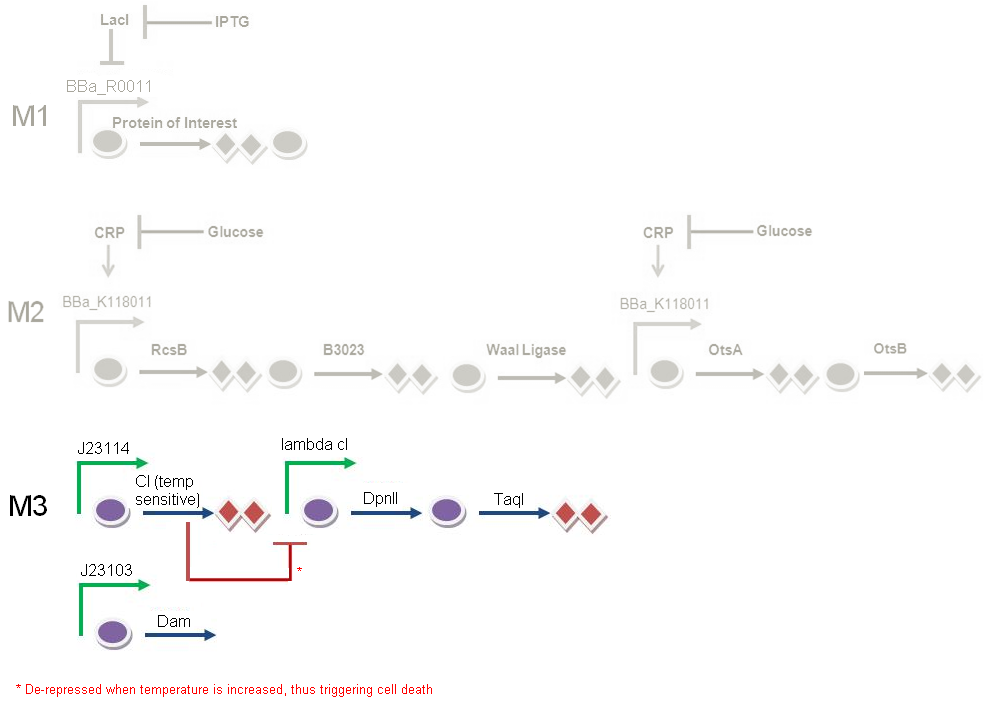
Module 3, which is cell death, is kicked off when the temperature is increased to 42°C.
At 28°C, the cI protein is constitutively produced, which represses the lambda cI promoter, hence inhibiting the production of the downstream restriction enzymes DpnII and TaqI. Dam methylase is produced constitutively from a non-leaky promoter. When Dam is being produced, DpnII and TaqI are unable to recognise the restriction sites on the gene, therefore preventing the DNA from being cut, thus keeping the cells alive.
When increasing the temperature to 42°C, killing occurs. Here, cI is no longer able to repress the lambda cI promoter. The promoter is now able to transcribe the downstream restriction enzymes DpnII and TaqI. Dam will no longer be able to protect against restriction digest of genetic material. The DNA will be cut, which completes cell death in M3.
Testing Rationale
1) Promoters
- test and characterise promoters by relating the input to the output
- this will give a quantitative measurement of the transcriptional activity of the promoter, thereby determining the level of gene expression
2) Thermoinduction
- show that on coupling cI to the lambda promoter, cI represses the promoter activity
- show that repression can be lifted when the temperature is raised (specifically from 30oC to 42oC)
3) Killing mechanism
- show that when restriction enzymes are induced, the cell will die
- show the rate at which the cells die
- show the restriction enzyme rate of killing that occurs (by relating this to the rate that the cells die)
4) Dam methylation
- show that methylation is occuring
- show that with Dam -ve the cells will die due to their basal level of restriction enzymes.
- show that on adding our Dam gene the cells will be kept alive. (Methylation of the DNA occurs which protects the genetic material from cleavage).
DNA constructs
Two standard BioBricks are used for testing - BBa_E0240 (BB1) and BBa F2620 (BB2).
- BB1 consists of a GFP production device, and can be used to characterise the strength of both constitutive and inducible promoters. The standardised Jason Kelly approach will be used to test both BBa_J23114 and the pLambda promoter.
1) Promoter testing
Promoter: BBa_R0051 (repressible, pLambda promoter)
Testing construct: RBS - GFP - Terminator. (BBa_E0240)
2) Thermoinduction
GFP
J23114 - RBS - cI - TT - pLambda - BB1

Beta-galactosidase (backup in case GFP does not work)
BB2 - RBS - cI - TT - pLambda - RBS - LacZ - TT

- James Field 08:38, 11 August 2009 (EDT): KKKKUUUUNNNNN- Nooooooooooooooooooo........ BioBrick that we have from the registry only please!!! But to be honest if this is the best assay then go for it, but if it is just as good as the GFP output then go for the latter. Also, GFP output is easier to quantify than LacZ.
3) Killing strategy
- The tightly regulated pBad inducible promoter is chosen to test our restriction enzyme constructs.
J23114 - RBS - cI - TT - pLambda - RBS - DpnII - RBS - TaqI - TT


Cloning strategy (assembly)
Blast search between Escherichia coli K-12 substr. MG1655 and Escherichia coli BL21(DE3).
| Gene | Strain | Score | Expect | Identities | Gaps |
| Dam | Escherichia coli BL21(DE3) | 1535 bits (831) | 0.0 | 835/837 (99%) | 0/837 (0%) |
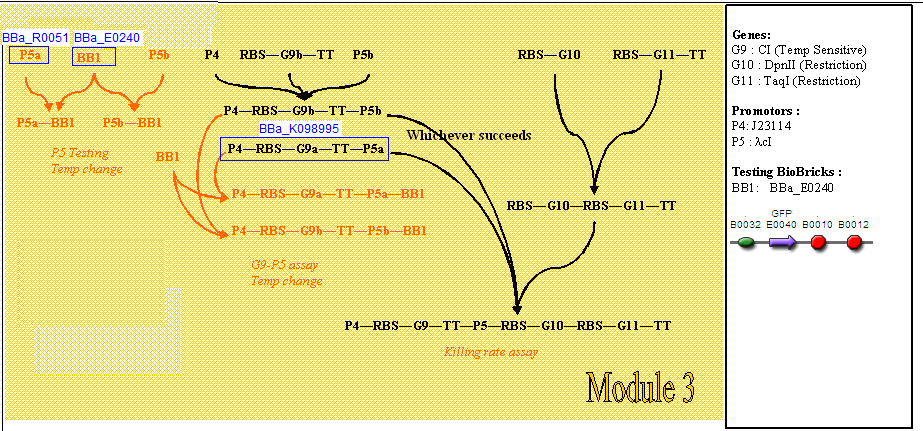
The diagram below shows the critical pathway for our cloning strategy.
- The cloning steps we will undertake to produce our test constructs are shown in orange.
- The cloning steps we will undertake to produce our final constructs are shown in black.
Ligation Strategy
Note: P51 is the registry promoter BBa_R0051. P52 is the synthesised promoter (with a slightly different sequence).
| Number | Starting Parts | # of ligations | SLIC or Standard BB Assembly | Final Construct | Details |
| (1) | P51 + BB1 |
1 | SBBA | P51 - BB1 | This is to test the registry P5 |
| (2) | P52 + BB1 |
1 | SBBA | P52 - BB1 | This is to test the synthesised P5 |
| (3) | (RBS - cI - TT) + (1) |
1 | SBBA | (RBS - cI - TT - P51 - BB1) | |
| (4) | (RBS - cI - TT) + (2) |
1 | SBBA | (RBS - cI - TT - P52 - BB1 | |
| (5) | BB2 + (3) |
1 | SBBA | (BB2 - RBS - cI - TT - P51 - BB1) | |
| (6) | BB2 + (4) |
1 | SBBA | (BB2 - RBS - cI - TT - P52 - BB1) | |
| (7) | P4 + (3) |
1 | SBBA | (P4 - RBS - cI - TT - P51 - BB1) | |
| (8) | P4 + (4) |
1 | SBBA | P4 - RBS - cI - TT - P52 - BB1 | |
| (9) | P4 + BB1 |
1 | SBBA | P4 - BB1 | |
| (10) | BB3 + (RBS - DpnII) + TT |
2 | SBBA | (BB3 - RBS - DpnII - TT) | |
| (11) | BB3 + (RBS - TaqI - TT) |
1 | SBBA | (BB3 - RBS - TaqI - TT) | |
| (12) | BB3 + (RBS - DpnII) + (RBS + TaqI - TT) |
2 | SBBA | (BB3 - RBS - DpnII + RBS + TaqI - TT) | |
| (13) | P4 + (RBS - cI - TT) + P5 + (RBS - DpnII) + (RBS - TaqI - TT) |
4 | SLIC | (P4 - RBS - cI - TT - P5 - RBS - DpnII - RBS - TaqI - TT) | This will only be constructed with one P5 (using testing previously to determine which one) |
Assays & Protocols
1) Promoter Characterisation
Promoter characterisation
F2620 characterisation
2) Thermoinduction
GFP test of cI + p(lambda)
Effect of Temperature
Beta Galactosidase (back up in case GFP does not work)
3) Killing strategy
Staining Assay (rate of killing)
Membrane Staining ( This may move to module 2)
Effect of Temperature on killing rate
Output data
1) Promoter characterisation
After background subtraction, time-series fluorescence (F) and absorbance (ABS) measurements were collected from the assay. These were used to calculate the PoPS output of the promoter compared to the reference standard construct by the following equation:

The data (raw fluorescence and OD readings) were inputted into the SPU calculator to get the Standard Promoter Units (PoPS).
SPU calculator found here.
2) Thermoinduction
Beta-galactosidase
Miller Units for the activity of Beta-galactosidase (in micromoles per ml).
Miller Units= 
Miller (1973) noted that 1 mg of beta-gal was equivalent to 300 OOO units of activity Mass of beta-gal is 116kDa. Therefore, moles of beta-gal can be correlated to Miller units of activity by the equation: Moles= (1/116)* Activity/(300 000)
GFP
After background subtraction, time-series fluorescence (F) and absorbance (ABS) measurements were collected from the assay. These were used to calculate the Relative Fluorescence Units (RPU). Relative Fluorescence Units= (time-series fluorescence - blank)/(absorbance - blank)
The fluorescence from the lambda promoter can be characterised by the equation for RPU (refer to part 1)
3) Killing Strategy
Cell staining (rate of killing)
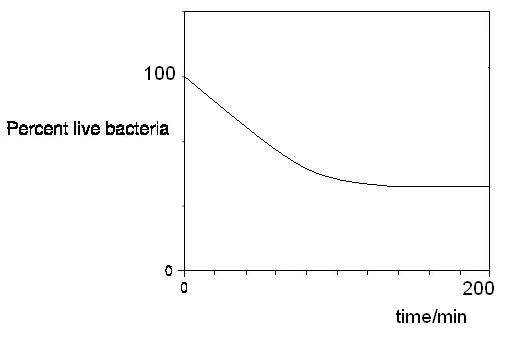
From the ratio of green to red fluorescence intensity, we can get the percent live cells from a standard calibration curve (see cell staining assay- calibrating standard curve)
Therefore, we can get a plot of the percent live cells over time. The rate of killing can be derived from this plot in terms of percent killed cells per unit time.
Colony Forming Units
The two plates, one control (containing live cells) and one containing the restriction enzymes (therefore dead cells) can be compared. There should be noteably fewer bacterial colonies on the plate where the restriction enzymes have killed the cells.
Using the colonies counted, the number of bacteria per mL of diluted sample can be determined using the equation:

(For example, if for the 1x 10⁻⁸ dilution plate you plated 0.1 mL of the diluted cell suspension and counted 200 bacteria, then the calculation would be: 200/0.1 mL x 10-8 or 200/10-9 or 2.0 x 10^11 bacteria per mL.)
2. We can then calculate % efficiency of our killing strategy. We use the calculation below for each dilution plate.
Restriction Enzyme Assay
Enzyme kinetic parameters, KM− and kcat− values, were calculated from vo versus c diagrams by a best fit to the Michaelis–Menten equation.
Enzyme activity = kcat × reaction volume (μmol min-1)
This enzyme activity is proportional to expression levels.
Please click the link contained in the title to be redirected to the modelling directions for this module.
1) Promoter characterisation
To determine in modelling how the PoPS Output of the promoters varies with time.
2) Thermoinduction
The temperature dependence of the promoter activity can be modelled.
3) Killing strategy
Restriction Enzymes and Methylation
In our assays, we have determined quantitatively the enzymatic activity of our restriction enzymes and methylases. The balance between the amount of methylases needed to protect against the restriction enzymes, and the amount of methylase that will stifle restriction enzyme activity, can be modelled. From our in vitro derived models, we will hopefully come up with an optimum amount of methylation for our setup as well as after varying the promoter leakiness.
Shopping list
2) Thermoinduction
Beta-gal assay
| Product | Company | Cat # | Cost | Link |
| o-nitrophenyl-β-D-Galactoside (ONPG) | Sigma | 73660-1G | 17.60 GBP | Purchase here |
| Hexadecyltrimethylammonium bromide | Sigma | H5882-100G | 23.00 GBP | Purchase here |
| Sodium deoxycholate | Sigma | D6750-10G | 14.20 GBP | Purchase here |
OR
| Product | Company | Cat # | Unit size | Cost | Link |
| Beta-galactosidase detection kit | Promega | E2000 | 65 tests/200 in 96 well plate | 104 GBP | | Purchase test here |
3) Membrane Staining
Staining assay (rate of killing)
| Product | Company | Cat # | Unit size | Cost | Details | Link |
| LIVE/DEAD® BacLight - Bacterial Viability Kit for microscopy and quantitative assays | Molecular Probes - Invitrogen | L-7012 | 1000 individual tests in 96-well assay plates | £285 | * Kit Components:
SYTO 9 dye, 3.34 mM (Component A), 300 μL solution in DMSO |
Purchase test here |
| Product | Company | Cat # | Unit size | Cost | Details | Link |
| Viability/Cytotoxicity Assay kit for Bacteria Live and Dead Cells | Biotium | 30027 | 100-1000 assays | £152(converted) | * Kit Components:
Component A, DMAO: 2x100 μL, 5 mM in DMSO |
Purchase test here |
3) Restriction Enzyme Assay
Restriction Enzyme Assay
Note: We will either need Molecular Beacon Synthesis 6-FAM7 OR Molecular Beacon Synthesis TAMRA from the table below.
| Product | Company | Type | Cost | Details | Link |
| Molecular Beacon Synthesis | Tri link biotechnologies | 6-FAM7 | £274(converted) | Purchase here | |
| Molecular Beacon Synthesis | Tri link biotechnologies | TAMRA | £365(converted) | Purchase here | |
| Synthesis+ Modification | Biomers | Synthesis | £0,28 per base per oligo for 0.2 μmol | Purchase here | |
| Synthesis+ Modification | Biomers | Modifications | £92 for S (2-5OD) | Purchase here | |
| DpnI | Promega | # 200u | £44 | Code: R6231 | Purchase here |
| S-(5'-Adenosyl)-L-methionine p-toluenesulfonate salt | Sigma | A2408-25MG | £32.22 | Purchase here | |


