IGEM:IMPERIAL/2009/M3/Assays/RE
Restriction Enzyme Assay
Aims
- This is to measure activity of the restriction enzymes DpnII and TaqI used in the killing strategy.
- DNA cleavage due to restriction enzyme activity is monitored by the fluorescence signal generated upon substrate hydrolysis.
Assay Principles
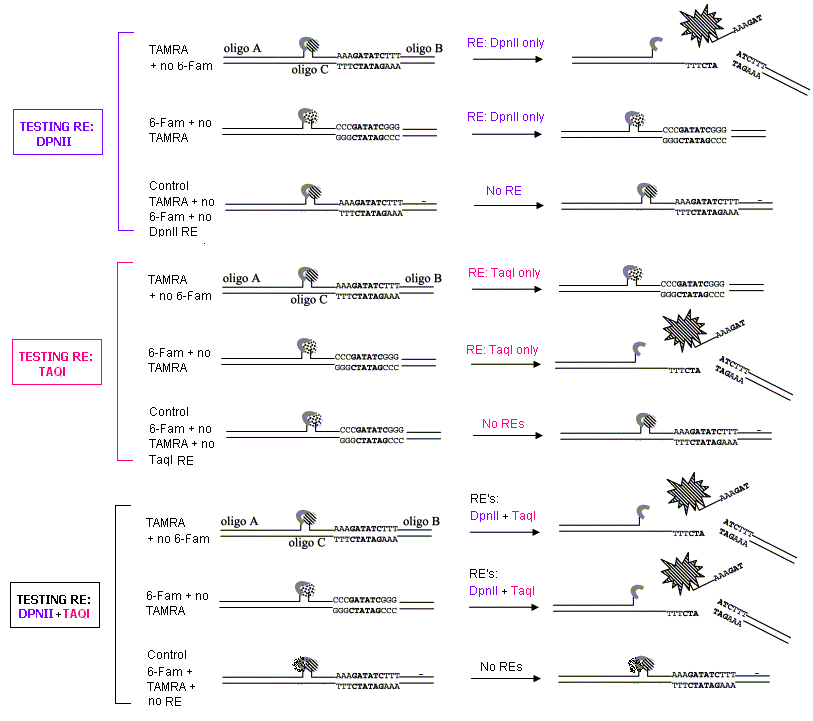
The basic setup uses a DNA molecule consisting of three different oligonucleotides conjugated to a fluorophore. Oligo B and C contain the restriction enzyme recognition site. The fluorophores are quenched in the non-cleaved state, but released when the appropriate restriction enzyme is added.
The two fluorophores, TAMRA and 6-Fam, emit at different wavelengths (see protocol) and are cut by DpnII and TaqI respectively. The following diagram shows the principle of testing each restriction enzyme in this assay individually, and then together. Controls are used throughout as shown.
The fluorescence produced is measured at specific time intervals and a graph of GFP against time plotted. Using this method, the increase in the signal can easily be quantified as more DNA is cut, and rate constants determined.
Note: All DNA molecules also have Dabcyl attached.
Equipment
Reagents
- Oligos A, B and C tagged with TAMRA and Dabcyl for testing DpnII
- Oligos A, B and C tagged with 6-FAM and Dabcyl for Taq1
- Buffer: 100 μl 20 mM Tris–HCl, pH 7.5, 50 mM NaCl, 10 mM MgCl2, 100 μg ml−1 bovine serum albumin (BSA)
Protocol
Preparation of oligos
1) The three oligodeoxynucleotides forming the respective substrate were mixed in equal amounts and heated to 95 °C in a water bath.
2) Cool to ambient temperature and stored as 30 μM stock solutions.
Protocol Procedure
1) 0.125, 0.25, 0.5, 1, 1.5 and 2 μM of substrate were diluted in buffer and added into spectrophotometric cuvettes.
2) Restriction enzyme purified from cell extract was added at a concentration which was at least 10-fold lower than the substrate concentration.
There was a control setup where no Restriction Enzyme was added.
3) At defined time intervals, the average fluorescence at the wavelengths indicated above were determined. (The excitation wavelength was 560 nm for TAMRA and 488 nm for 6-Fam, while the emission was measured between 570 and 590 nm for TAMRA and between 512 and 522 nm for 6-Fam in 0.2 nm steps).
4) A TAMRA reading shows activity of DpnII, while a 6-FAM reading shows activity of Taq1.
5) To complete substrate cleavage a 10-fold excess of enzyme was added at the end of the experiment.
6) Initial velocities (v0) were calculated from the linear part of individual reaction progress curves.
