Falghane Week 12
Purpose
The purpose of this assignment is to analyze Table 1 from Tai et al (2007) and extract models from 2-nutrient chemostat simulation in MATLAB for both Glucose limited and Ammonium limited media.
Methods
Tai et al. (2007) Paper Questions
- The yield quantity Y Glu/X: this is a ratio of what quantities? Be specific and relate to the 2-nutrient chemostat model from class.
- Y Glu/x is the ratio of glucose biomass/ glucose consumed.
- The flux qGlu is a ratio of what quantities? Be specific and relate to the 2-nutrient chemostat model from class.
- the qGlu ratio is the ratio of mmol/gram. Which is the ratio of growth rate/ yield quantity.
- Convert residual glucose and residual ammonia from mM to grams.
- (1mole/1000mM)*(180.156 g glucose/ 1 mole) = 0.180156 g of glucose.
- (1mole/1000mM)*(17.031 g/ 1 mole) = 0.017031 g of ammonia.
Residuals
- Glucose:
- Glucose limited at 12°C: 0.0504 g
- Glucose limited at 30°C: 0.054 g
- Ammonium limited at 12°C: 16.21g
- Ammonium limited at 30°C: 15.33g
- Ammonium:
- Glucose limited at 12°C: 1.17g g
- Glucose limited at 30°C: 1.11g g
- Ammonium limited at 12°C: 0.026g
- Ammonium limited at 30°C: 0.0034g
Equations:
- dx/dt= rx(yz/(y+K)(z+L)) -qx
- dy/dx= -Erx(yz/(y+K)(z+L)) -qy +qu
- edz/dt= Frx ((yz/(y+K)(Z+L) -qz + qv
Matlab Stimulation
- Determine the length of time the chemostat is operated before data is collected.
- 3 volume changes took a place before the data was collected and since the culture volume was 1L and the ratio was 1L/0.03h, the length was approximately 100 hours
- Determine as many model parameters as you can from these data: use the "warm" data and both glucose- and ammonium-limited data.
- r= the maximum rate of growth.
- K= glucose concentration at r/2.
- q= dilution rate.
- L= ammonium concentration at r/2.
- E= glucose efficiency.
- F= ammonium efficiency.
- u= glucose feed concentration.
- v= ammonium feed concentration.
Parameters determined from the data:
- Glucose limited:
- r= 0.46hr-1
- K= 0.778g/L
- q= 0.03hr-1
- L= 15.91g/L
- E= 14.3
- F= 2.23
- u= 25g/L
- v= 5g/L
- x0= 1g/L
- y0= 2g/L
- z0= 1.1g/L
- Ammonium Limited
- r= 0.46hr-1
- K= 0.778g/L
- q= 0.03hr-1
- L= 15.91g/L
- E= 25
- F= 0.526
- u= 25g/L
- v= 5g/L
- x0= 1g/L
- y0= 20g/L
- z0= 3.5g/L
Results
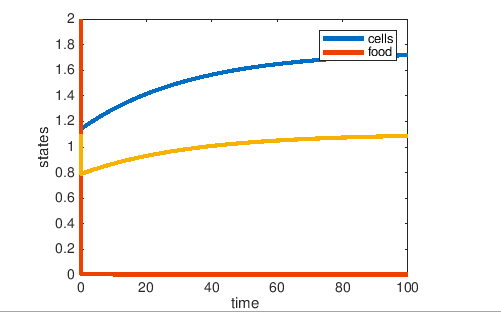
 Figure1: The resulting graph for glucose-limited media.
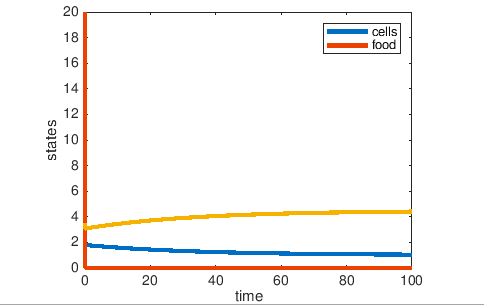
 Figure2: The resulting Graph of Ammonium limited media:
- Do the graphs show the system going to steady state?
- yes the graphs show the system going to steady state
- Do the steady states match the Table 1?
- No the steady states were reached before 100 hours.
Scripts
- Carbon limited script: File:Chemostat dynamics glucose.pdf
- Ammonium limited script:File:Chemostat dynamics ammonium.pdf
Conclusion
Shown by the graphs, in both Glucose limited and Ammonium limited media, the glucose was consumed rapidly. However, in the Glucose limited media, the number of cells increased then reached a high steady state. In the Ammonium limited media, the number of cells decreased as Glucose was consumed and ammonium decreased and reached a low steady state.
Acknowledgments
- My partner Leanne K. Kuwahara helped me over text and in class.
- Dr. Ben G. Fitzpatrick, Ph.D. helped me with MatLab in class
- Except for what is noted above, this individual journal entry was completed by me and not copied from another source.
Falghane (talk) 13:23, 26 April 2019 (PDT)
Refrences
- Tai, S. L., Boer, V. M., Daran-Lapujade, P., Walsh, M. C., de Winde, J. H., Daran, J. M., and Pronk, J. T. (2005). Two-dimensional transcriptome analysis in chemostat cultures: combinatorial effects of oxygen availability and macro- nutrient limitation in Saccharomyces cerevisiae. J. Biol. Chem. 280, 437–447.
- Tai, S. L., Daran-Lapujade, P., Walsh, M. C., Pronk, J. T., & Daran, J. M. (2007). Acclimation of Saccharomyces cerevisiae to low temperature: a chemostat-based transcriptome analysis. Molecular Biology of the Cell, 18(12), 5100-5112. DOI: 10.1091/mbc.e07-02-0131
- Assignment Week 12