BME100 s2018:Group8 W1030 L6
| Home People Lab Write-Up 1 | Lab Write-Up 2 | Lab Write-Up 3 Lab Write-Up 4 | Lab Write-Up 5 | Lab Write-Up 6 Course Logistics For Instructors Photos Wiki Editing Help | |||||
OUR COMPANY
Fluoruler LAB 6 WRITE-UPBayesian StatisticsOverview of the Original Diagnosis System The lab tested 16 patients for disease-associated SNP. The lab was divided between 8 teams and each team tested 2 patients. To prevent error in this lab, each patient's DNA had three replicates. To compare the results a positive and negative control were provided to each team, the positive control had the disease-associated SNP, while the negative control did not. The teams used the ImageJ software to check for a green florescence. For calibration, using the same setup, which would later be used with the patients' DNA sample, the teams took three images of known concentrations of DNA and generated a calibration curve. Similarly, 3 images were taken for each patient's sample. The results of this lab were: 9-Conclusive, 5-Inconclusive, and 2-Blank. 5 out of the 9 conclusive results agreed with the doctor's diagnosis which was done beforehand. Our team did not come to a conclusion for either of the patients and this is because of the errors we made during the lab. We frequently readjusted the distance and angle of the camera, this resulted in unreliable images. In some cases, the sample wasn't fully drawn from the tubes, resulting in unequal volumes. The disorganization of the images also resulted in confusion and therefore inaccurate data values. What Bayes Statistics Imply about This Diagnostic Approach
Calculation 3 and 4 Results: Approximately 115% of the PCR replicates concluded that a patient will develop the disease SNP, and approximately 120% will not. Therefore, the probability was larger than 1 in both cases, which shows that PCR is reliable in predicting the development of the disease. The lab procedure had ample room for error because of the contamination, as we re-used the same slide, and improper handling of the samples. Moreover, maintaining the same distance and angle for each sample was not possible, and this produced incomparable images. Human errors such as drawing different volumes for each sample also produced inaccurate data and the disorganization of the images also contributed to the error. Intro to Computer-Aided Design3D Modeling Our team used Tinkercad to design our product. It was a lot less complicated, colorful, and easier to play with than Solidworks. However, there was a disadvantage: the lack of accuracy when superimposing objects. It was difficult to ensure symmetry and coinciding, which can easily be done with Solidworks' Mate feature. For simpler designs we think it is better to use Tinkercad since it is faster, but when assembling components Solidworks has a better accuracy.
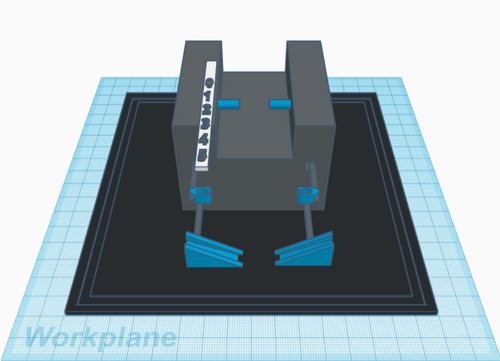
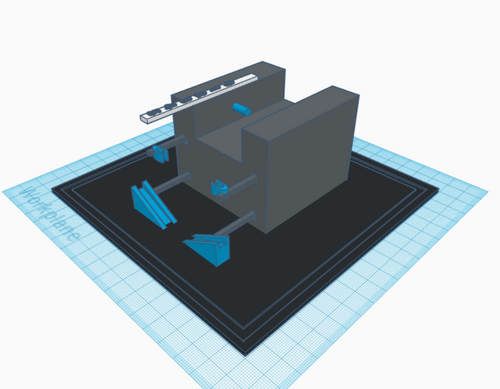
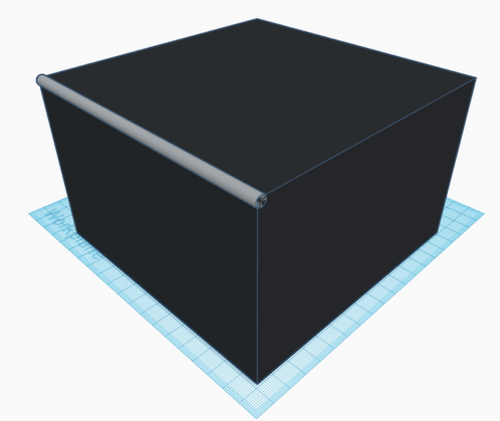
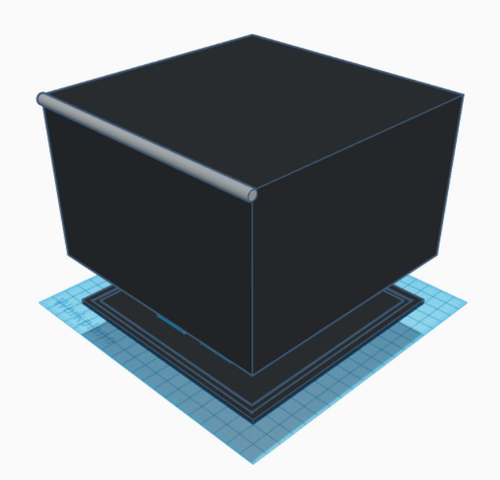
The reason why we have come up with this design is because it addresses the steps where we made an error. For instance, the distance of the sample from the camera was never constant (4 cm in our case), and the angle of the camera varied too. Therefore, adding a ruler to the original design will ensure that our design maintains the same distance after each trial. Since we re-used the slides and moved it back and forth, we have decided to add rails to the structure. Once the phone has been fixed in the slots, we can slide it however we like, while maintaining the same angle and the same distance. This was difficult for us to do during the lab, so adding a ruler, slider, and phone holders, which the original design missed, we can take better images. The size of the box has been reduced as well, there is a flap in the front, and the box and base are designed such that it fixes itself-in the created rectangular slot-minimizing any source of light to interfere.
Feature 1: ConsumablesConsumables should be provided by the scientist or person conducting the experiment. Our product will use the standard PCR reaction consumables found in kits and are easily obtainable. These standard consumables are the PCR mix, primer solution, SYBR Green solution, buffer and the DNA being tested. The experimenter is also responsible for gathering together any and all protective wear and other consumables like plastic tubes, glass slides, and a smartphone. Our product will include railings and a ruler on the fluorimeter. With the railings incorporated into the design, the phone taking pictures and the slides we are using will stay in the position it needs to be and if it does move, the ruler is there to ensure that the slide is in the right place for a clear and accurate picture. Minimizing the chances of a problem during the experiment; something our group had problems with. Feature 2: Hardware - PCR Machine & FluorimeterAfter obtaining all the materials for the experiment, the ones conducting the experimenter will add the correct primers and reaction mix to the samples of DNA. Then after placing the specimens in the PCR machine, the machine will run as usual and elongate the DNA and increase its concentration. In order to get this end goal, the machine heats up 95°C, cools it to 57°C, then to 72°C, and then heating it up to 95°C. After this process is completed, the samples are tested in the fluorimeter. By placing a slide in the fluorimeter, we are able to place drops of our samples on the slide and take pictures in a completely dark space. This is where the railings and ruler will best help us achieve accurate results. The railings will help keep everything in place and the ruler will help us make sure the samples are at the right distance from the camera on the phone. That way, when we close the fluorimeter to take pictures, the phone will accurately get a clear image , allowing it to be looked at through ImageJ. Then with all the information gathered, we can make a full and detailed report. It's important to note that our design will include railings that securely holds the phone and a ruler that helps keep the slide and sample at the right distance. Giving our chances of a low quality image to be substantially lower. It will make the process go by a lot faster, relieving the stress of constantly wondering if the images will come out adequately. Creating a new fluorometer with railings and a ruler will solve complications we had in the procedure. While conducting the procedure, the phone wouldn't stay in its position correctly, slipping out of the position it's supposed to be in. Also, constant placement of new samples caused the slide to move and not be in its correct position. All together these complications made it hard to define whether or not we have an accurate reading of the samples. Which is why we decided to add these features. Like we said before, the railings will keep the phone steady and the ruler will keep the slides alignment in check.
| |||||


