BME100 s2018:Group7 W1030 L5
| Home People Lab Write-Up 1 | Lab Write-Up 2 | Lab Write-Up 3 Lab Write-Up 4 | Lab Write-Up 5 | Lab Write-Up 6 Course Logistics For Instructors Photos Wiki Editing Help | ||||||||||||||||||||||||||||||||||||||||||||||||||||||||||||||||||||||||||||||||||||||||||||
OUR TEAM
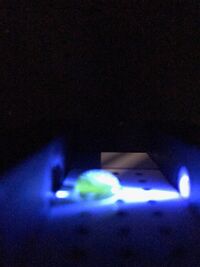
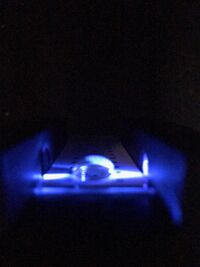
LAB 5 WRITE-UPPCR Reaction ReportThe pre-lab reading helped our group tremendously with learning how to pipette samples. Some of the group members did not originally know how to us a pipette, but after reading about it, we were successfully able to pipette the samples to set up the reaction. It is important for all of us to understand how to use a micropipettor correctly because it can break easily. The first stop on the micropipettor is passed and used in order to collect the sample solution. The second stop is pressed down in order to add an extra puff of air in order to get all of the sample solution out of the tip of the micropipette. As we found out through human error, if the second stop is pushed down before the sample solution is collected, there would be a higher volume in the micropipettor than it is set to, causing error in calculations and measurements. The final did not have an exact, perfect amount of the amount of liquid, but there was only a very small variation, most likely due to human error. There was a small amount of the PCR reaction mix that was left at the bottom of the tubes. Our labeling scheme remained consistent with our experiments. Fluorimeter ProcedureImaging set-up SmartPhone 1: iPhone 7 To start the imaging setup, the phone should be set on camera mode with a timer on. This experiment in particular used an iPhone 7. The phone is then placed on a stand so that the height of the camera matches that of the glass slide. The phone is then adjusted making sure that it is right on the edge of the slide, capturing the sample from a side view. The phone should be around 4 cm away from the sample. Once the experiment is setup, everything should be covered with a lightbox leaving only one flap open. The phone is then checked one more time to make sure it is focused on the sample. Once everything is in focus, the timer is started and the flap is closed so that the picture can be taken in the dark. The same process is then repeated for the other samples with three pictures taken for each.
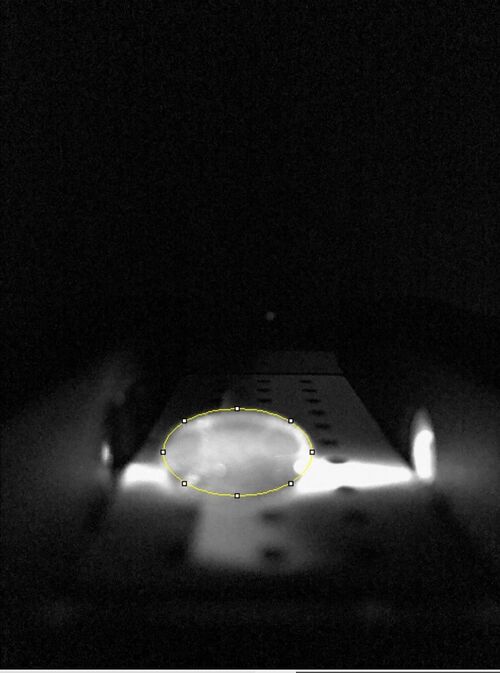
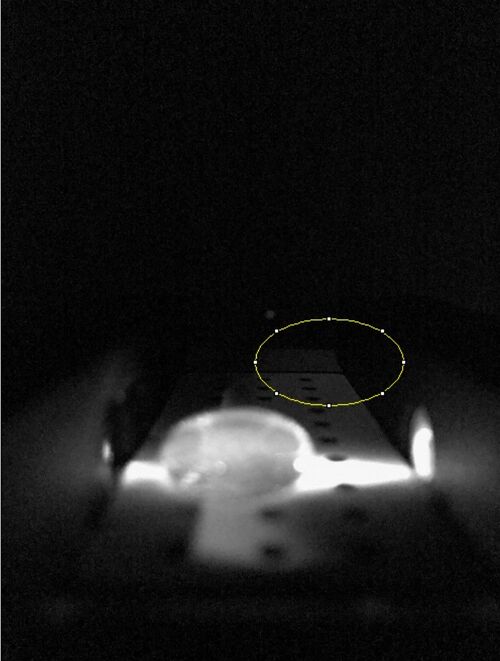
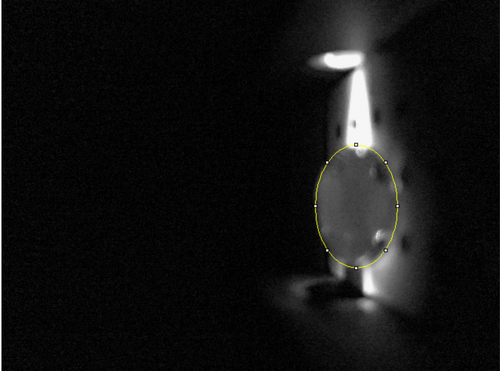
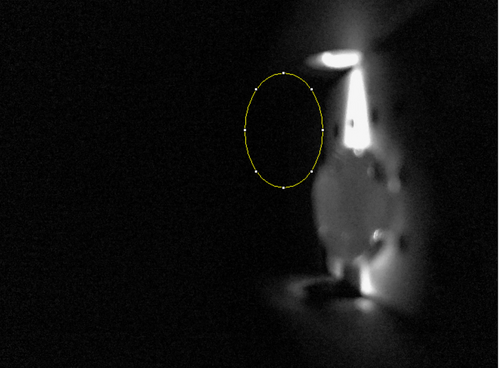
Data Collection and AnalysisImages of High, Low, and Zero Calf Thymus DNA High Calf Thymus DNA Low Calf Thymsus DNA Zero Calf Thymus DNA Due to human error, there was no zero calf thymus data collected. A sample was taken from a different group but the pictures were different and the data would have skewed our data. This error affected all of our results. Calibrator Mean Values
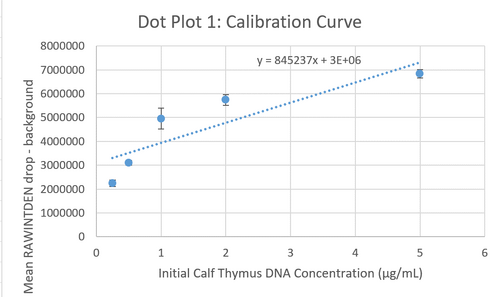
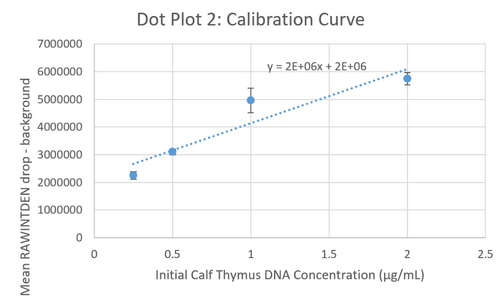
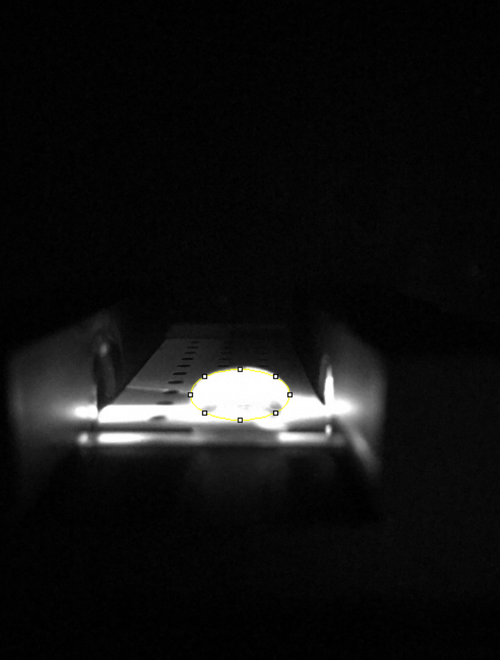
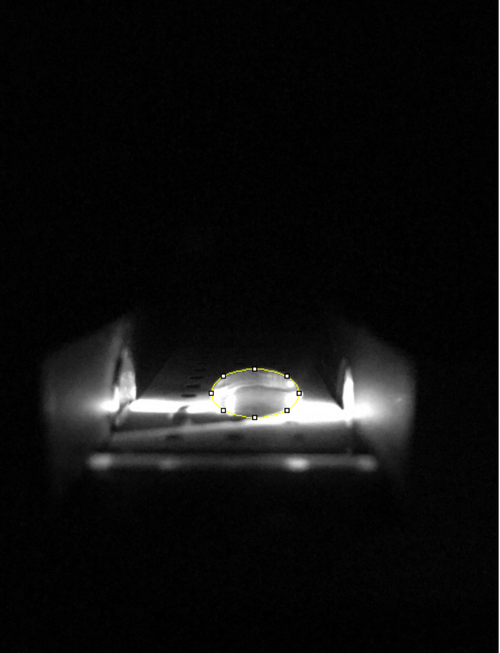
Calibration curves Images of Our PCR Negative and Positive Controls Positive Control Negative Control PCR Results: PCR concentrations solved
The image of the drop as seen below shows some green coloring. The results look similar to that of the positive control but the quantitative results tell a different stories. The quantitative results are in between the results gathered in the positive and negative controls trials. Because of this, the test proved to be inconclusive.
The image of this patient's drop as seen below shows no green coloring. The results look very similar to that of the negative control but the quantitative results tell a different stories. The quantitative results correlated with that of the negative results. Because of this correlation, a conclusion was made that patient 31082 is positive. Conclusions
References | ||||||||||||||||||||||||||||||||||||||||||||||||||||||||||||||||||||||||||||||||||||||||||||


