BME100 s2018:Group6 W1030 L6
| Home People Lab Write-Up 1 | Lab Write-Up 2 | Lab Write-Up 3 Lab Write-Up 4 | Lab Write-Up 5 | Lab Write-Up 6 Course Logistics For Instructors Photos Wiki Editing Help | |||||
OUR COMPANY
GALL LAB 6 WRITE-UPBayesian StatisticsOverview of the Original Diagnosis System The BME 100 lab was divided into 7 teams of 3 to 4 students to diagnose 14 patients for the disease-associated SNP. There were 8 teams and 16 patients originally, but one team was not able to complete their PCR reaction and analysis. Each team had two patients and completed PCR amplification and fluorimeter testing for each patient. To ensure that the results were correct, there were several things that were done to prevent error. First, there were three samples for each patient DNA. Having these replicates ensured that the results of a patient were indeed correct since we were able to compare them. If, on average, the three samples produced the same results, we knew that the process yielded a correct result. Along with the patient samples, we incorporated PCR controls in the process. One of the controls was positive for the diseased SNP and the other was negative. After going through the PCR process, the numerical values of the positive and negative controls were the standard to which the patient values were compared. After taking pictures of the 8 PCR reaction samples with the SYBR Green I, the pictures were imported to ImageJ to be processed. In order to minimize error, we used the same area of the droplet for each picture and we only considered the green light when adding completing the analysis. Another way to eliminate errors in Image J was to use 3 images for each SYBR Green sample. In this way, we were able to make sure that the correct numerical values were inputted into Excel by comparing each of the 3 values. According to the doctor's conclusions, 5 of the 14 patients had positive results and 8 out of the 14 had negative results. Overall, though the PCR process, the class was able to determine that 3 patients had positive results, 6 negative results, and 4 inconclusive results. The final probability that a patient will get a positive final test conclusion, given a positive PCR reaction is 54% and the probability that a patient will get a negative final test conclusion, given a negative PCR reaction is 72%. What Bayes Statistics Imply about This Diagnostic Approach
The reliability for calculation 1 was about 50% so there is obviously some correlation with the PCR reactions and the conclusion that a person has the disease. However, the correlation is not too high, which means that the reliability is not too good. So, if a patient was given a positive PCR reaction, the final result could be either positive or negative. For calculation 2, the reliability was considerably higher and closer to 100% which implies that the reliability is generally better and more trustworthy. If a patient has a negative PCR reaction, there is a great chance that the final test conclusion is also negative.
The results of calculations 3 and 4 imply that the reliability of PCR predicating the development of the disease were close to 100%. So, if the patient was given a positive diagnostic signal, there would be a high likelihood that he or she will develop the disease and likewise for a negative diagnostic signal not leading to the disease. The Bayes values were high, close to 100%, so we know that the reliability is additionally high.
One possible source of human error that could have occurred during the PCR process was micro pipetting. There could have been slight contamination even if the tips were disposed since the tubes were so close to each other, the tip could have accidentally hit another sample. Additionally, it was important that all the liquid be distributed to the other container and with the micropipetting, some of the liquid could have been left behind. Another error could have occurred with the PCR machine. Since the machines were not sophisticated, there could have been slightly different denaturing, annealing and elongating temperatures which could have affected the final detection values and therefore affected the Bayes values. Finally, the fluorimeter process used smart-phone pictures and the setup could have slightly differed for each run. Even though the distance between the slide and the camera was measured, it could have been slightly off for other trials. This would have affected the final detection results. Intro to Computer-Aided DesignOur Design
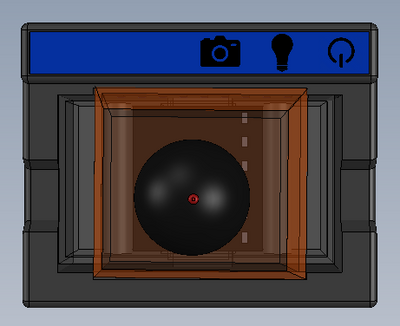
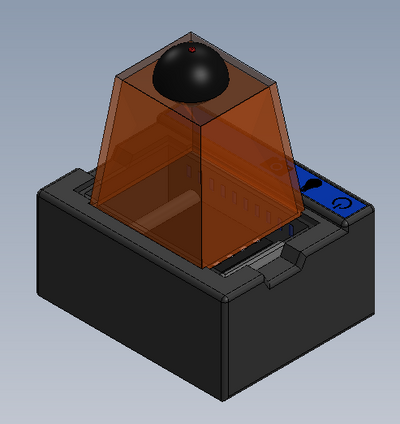
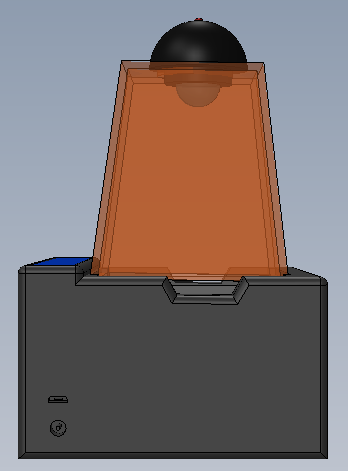
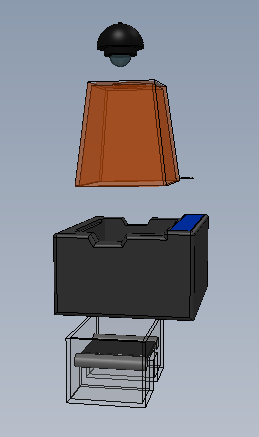
Feature 1: ConsumablesOur consumables kit includes the standard ware of PCR reactions, including the PCR mix, primer solution, and buffer. The DNA samples will, obviously, be provided by the person using the kit, and they will also be responsible for obtaining The consumables will be similar to the original fluorimeter machine. The PCR mix, primer solution, SYBR Green solution, buffers, and glass slides will be the same. The only changes that will be made will be the addition of a camera to the top of the fluorimeter. This addition will improve the picture quality of the samples and will facilitate the experiment by not needing a phone camera. Feature 2: Hardware - PCR Machine & FluorimeterThe Open PCR machine will be used to replicate and elongate the sample DNA and increase its concentration. This is accomplished by heating the sample to 95°C then cooling it to 57°C, raising it to 72°C, and then bringing it back up to 95°C. The fluorimeter will be used to analyze this liquid after the PCR machine, and test its fluorescence. This is accomplished by blocking all but a small portion of white light from entering the fluorimeter, and then measuring how brightly each sample glows using ImageJ and a picture taken by the fluorimeter. These processes are detailed further in a prior report. The major change from the previous iteration of this design is the incorporation of a camera into the fluorimeter itself, so that the camera angle and background concentration do not change at all when comparing the samples. Our base-model camera has a good lens, so it can zoom in fairly close, and a larger aperture, so that a fair deal light is absorbed, and the difference in concentrations are more clearly visible. As the concentration of DNA got smaller, it became less clear which concentration was which, simply because most of them hardly glow. With a larger aperture, these slight variations will be more distinguishable.
| |||||


