BME100 s2018:Group6 W0800 L6
| Home People Lab Write-Up 1 | Lab Write-Up 2 | Lab Write-Up 3 Lab Write-Up 4 | Lab Write-Up 5 | Lab Write-Up 6 Course Logistics For Instructors Photos Wiki Editing Help | |||||||||||||||||||||||||||||||||||||||||||||||||||||||||||||||||||||||||||||||||||||||||||||||||||||||||||
OUR COMPANY
LAB 6 WRITE-UPBayesian StatisticsOverview of the Original Diagnosis System In this lab, the DNA of 22 patients were tested by 11 groups, each group acting as the clinician for 2 patients. The DNA of each of the patients was tested using conventional PCR using Open PCR technology for a certain SNP known to be linked with diabetes. The diagnosis obtained by each group through Open PCR was checked against the “true” diagnosis as given by a doctor examining symptoms of the SNP. A number of steps were taken by each group to ensure that as few errors were made as possible. First of all, each group tested three samples for each patient to ensure that the result was not a fluke. Second of all, each of the three samples for each patient was checked against a positive and negative control that were designed to ensure that the test was working and to ensure that there was some kind of threshold for whether or not a patient should be considered positive or negative. A third way that errors were reduced is that 5 samples of calf thymus DNA were checked for fluorescence to create a calibration curve that, when run through ImageJ, allowed us to calculate an exact concentration of DNA in each of the samples for the patients. Finally, for each sample, three images were taken, meaning a total of 9 images per patient over 3 unique drops were used to determine the final diagnosis. All of these layers of support make the DNA more reliable and trustworthy. The results are as follows, and these results were then analyzed using Bayesian statistics to determine their reliability and validity:
What Bayes Statistics Imply about This Diagnostic Approach
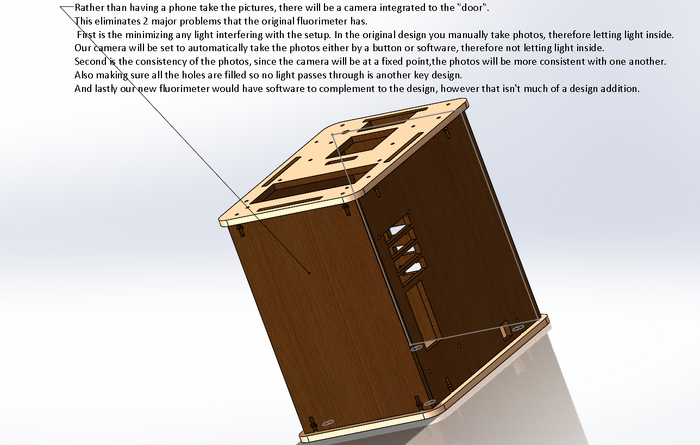
Intro to Computer-Aided Design3D Modeling Our Design We chose this design because it solved the 2 major problems the original fluorimeter has. Our different from the original design because it is more reliant on a software than humans. This helps it minimize the problems we had, which were the amount of light entering, and the consistency of the photos. Rather than having a human run the experiment, it will be more computerized and automatic. A human will almost never take the same photo every time, same height, same distance, etc. Since our camera is in a fixed spot, this helps take more consistent photos.
Feature 1: ConsumablesConsumable Kit: Since the consumable kit is just a kit, there cannot be a lot of consumables inside the box or else it would be inconvenient and ironic. So rather than having a computerized and automated assembly, it will have to include the necessary consumables and a few other things to minimize the size of the kit. So other than having the necessary tools, like primer, pipette and polymerase, we will include containers with specific requirements labels. The labels will have requirements like temperature, the amount of primer, the amount of polymerase, etcetera. Not only will they have requirements, but they will also have step by step This will help the people doing this test to be as accurate as possible. Also, to help out the people, we will package the tools in such a way that you do not have to look around for the tools you need. Rather, they will be already placed next to each other for less confusion and convenience. Feature 2: Hardware - PCR Machine & FluorimeterPCR Machine: The new machine will be more computerized to minimize the amount of human interaction. In the machine there will be a port where the phone will be placed. It will be leveled correctly so that the image can be seen. Since the machine will be more computerized, instructions will pop up on the screen to tell the user what to do step by step. The system will also be able to hold more data so that the user can store more PCR reactions. Fluorimeter redesign: The new fluorimeter will be much more integrated into one design than our original design. While the box and phone design is very simple and cheap and thus accessible, it has a number of flaws that make it less effective. First of all, the phone is not able to properly stand and take a picture of the water droplet while the door is closed. This means that the user is forced to choose between the ability to take a picture accurately and the ability to darken the area around the droplet to provide better contrast in the picture. Secondly, because the fluorimeter setup is not connected to a computer, the process of file management and analysis with the images becomes difficult and tedious. The user must transmit images from the phone to computer in such a way that each image is meticulously labeled-- it is far too easy for the user to make an error in this step alone. The image analysis that follows from this is very tedious as well, as the user must open each file in Imagej and then manually edit and analyze the image. With these two weaknesses as our guide, we have decided to make a few modifications to modernize and improve the fluorimeter setup. The first and most important change is to add a camera directly to the wall of the fluorimeter. This camera would be embedded in the door of the fluorimeter such that when the door is closed, the camera will be fixed at a set height above the ground. This addresses the weakness of the phone in two major ways: first, it ensures that the fluorimeter setup must be darkened for a picture to be taken. In addition, it ensures that the camera is stable and at a set predictable height so it is very easy to position the droplet accordingly. This camera will take a picture on the command of either a physical button or the control of the software described below. This software is the second major update to the fluorimeter. This software that will interface with the fluorometer and a computer. This software will be modeled in some ways off of the Real Time PCR software in that it will work on any computer if you type in the IP address. This allows it to be flexible and effective. Using this software the user can pictures and group images into folders in real time. This eliminates the danger of mislabeling or forgetting certain files. The software will also be preprogrammed to ready the image for imageJ analysis so all the user has to do is draw the circle and collect the data. These two modifications will allow the design to be as user friendly as possible and thus effective, while not adding an extreme amount of cost.
| |||||||||||||||||||||||||||||||||||||||||||||||||||||||||||||||||||||||||||||||||||||||||||||||||||||||||||


