BME100 s2018:Group5 W1030 L5

From OpenWetWare
Jump to navigationJump to search
BME 100 Spring 2018 Home
People
Lab Write-Up 1 | Lab Write-Up 2 | Lab Write-Up 3
Lab Write-Up 4 | Lab Write-Up 5 | Lab Write-Up 6
Course Logistics For Instructors
Photos
Wiki Editing Help

OUR TEAM

Name: Amelia Ikuta
Name: Kyle Williams
Name: Luke Roy
Name: Elena Gomez


LAB 5 WRITE-UP

PCR Reaction Report

Our experience with the pipetting went well. We all took turns to pipette the samples in the desired capsules, and got a feel for the tedious nature of sample pipetting. The pre-lab reading helped us to know what to expect from the lab, as well as knowing key terms and definitions within the lab. Being familiar with the material is definitely an advantage when dealing with a lab such as PCR Reaction. The first and second stop on the pipette was a little tricky at first, but we all got a hang of it. While using this instrument, it takes a great amount of dexterity as well as focus to perform at a high level. The final reactions did not all have the same amount of liquid in the end. There was no liquid left in the end of the capsules with the DNA and PCR reaction mix. No changes to the labeling were necessary.

Fluorimeter Procedure

Imaging set-up
To set up the imaging within the Fluorimeter, we arranged our smartphone in an orientation to take photos. We then adjusted the height of the platform to be level with the height of the camera, creating a flush plane between the lens and the surface of the fluorimeter. After, sample photographs were taken to again, test the the differential in the levels of the fluorimeter platform and the smartphone camera.

Placing Samples onto the Fluorimeter

  1. First we obtain 160 microliters of water and place the sample in between the first two rows of the slide using the pipette tool
  2. Activate the Blue LED and turn on the smartphone camera and see if the camera settings can be specialized
  3. Make sure the phone is positioned in the right way to take a clear picture of the drop. Adjust distance to make sure it is not blurry. When finalized, record the distance between the fluorometer and the camera.
  4. Obtain 80 microliter sample of the SYBR GREEN I and 80 microliters of the calf thymus solutions. Place this in between in the first two rows on the slide.
  5. Place the drop by adjusting the slide in the way that the BLUE LED is focused by the drop to the middle of the black fiber optic.
  6. Make sure to use the camera timer to capture the photo with minimal light exposure.
  7. Take three pictures of the drop while it is focused.
  8. Use the pipette to suck up the previous sample and move slide into next position.
  9. After these steps are replicated for all control and patient samples, clean area and place components in instructed disposal.


Data Collection and Analysis

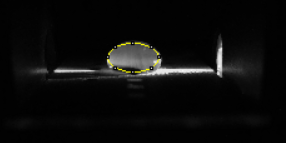
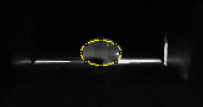
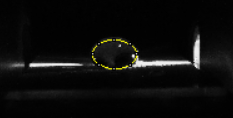
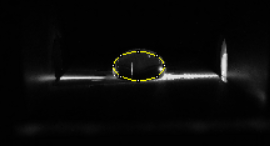
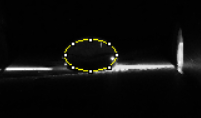
Images of High, Low, and Zero Calf Thymus DNA

5 uL

0.5 uL

0 uL


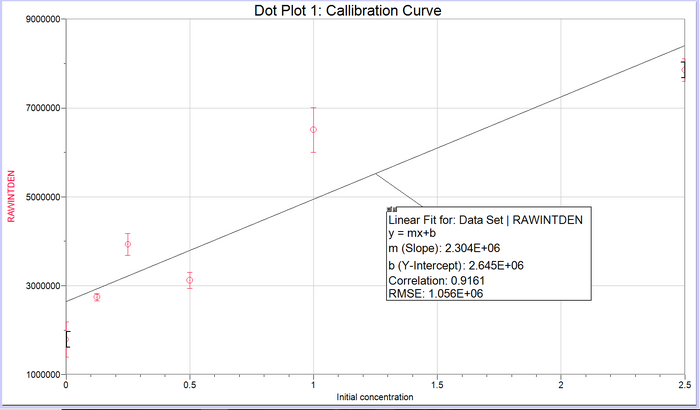
Calibrator Mean Values


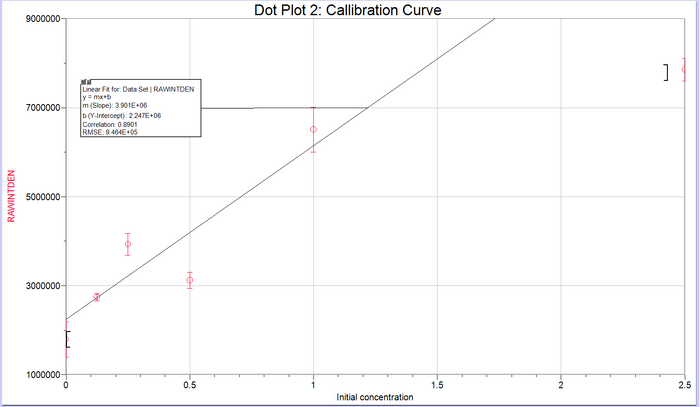
Calibration curves

Dot Plot 1

Dot Plot 1

Images of Our PCR Negative and Positive Controls


positive control

negative control

PCR Results: PCR concentrations solved


positive control


PCR Results: Summary

  • Our positive control PCR result was -1.578 μg/mL
  • Our negative control PCR result was -2.128 μg/mL


Observed results

  • Patient 60475 : 15.635 uL

The images of this patient's DNA clearly showed fluorescence.

  • Patient 89533 : -3.196 uL

The images of this patient's DNA clearly showed no fluorescence.

Conclusions

  • Patient 60475 :

Because the positive control was faulty (no fluorescence) The patient DNA cannot be compared to it. However, the clear difference in fluorescence between patients indicates that this patient tested positive.

  • Patient 89533 :

As mentioned above, the control values are inconclusive, but when compared to the first patient, this one appears to test negative.