BME100 s2018:Group1 W1030 L6
| Home People Lab Write-Up 1 | Lab Write-Up 2 | Lab Write-Up 3 Lab Write-Up 4 | Lab Write-Up 5 | Lab Write-Up 6 Course Logistics For Instructors Photos Wiki Editing Help | ||||
OUR COMPANY
Our Brand Name LAB 6 WRITE-UPBayesian StatisticsOverview of the Original Diagnosis System Between all of the students in the 10:30 section of BME100, 16 patients were tested for the disease-associated SNP. There were 8 teams that reported results, with each team consisting of 3 or 4 students. Several measures were taken to reduce error in diagnostics. Three replicates were tested for each patient to ensure that the results were accurate. When testing the concentration of DNA, controls were used to prevent false positives or false negatives. For the positive control, the disease-associated SNP was definitively present, and for the negative control it was absent. When calibrating the ImageJ software, DNA of six different known concentrations were tested to produce a calibration curve. Only the four lowest concentrations were used for the calibration, because the two highest concentrations were less accurate due to saturation. Three images were taken per calibration trial and for each patient's sample to further reduce error. As a whole, the class had 2 blank results and 5 inconclusive results. Of the 9 conclusive results, 5 of them agreed with the doctor's diagnosis. The biggest problem our group faced was while using the fluorimeter. We could not easily change the slide without changing the positioning of the light box or the camera stand, which needed to stay in the same position. We didn't change the slide frequently enough, which might have resulted in contaminated samples. What Bayes Statistics Imply about This Diagnostic Approach
The second calculation measured the probability of having a negative final conclusion, given that there was a negative PCR reaction. This measured the specificity to detect the disease SNP. The probability was almost 75%, which is a 3/4 chance that a negative diagnosis will be appropriately assigned. It also means that 1/4 of the time, the conclusion is a false positive. That is far too frequent, but with such a small sample size, further testing must be done to come to a more accurate conclusion. With this data, the PCR replicates were not reliable enough to accurately determine a positive or negative conclusion.
The fourth calculation measured the specificity to predict the disease, based on the probability of not developing the disease, given a negative conclusion. The fourth calculation had the same problem with it as the third calculation, such that the class result was over 1 but the actual result was 0.833. To check this calculation, P(A)=0.643, P(B)=0.429, P(B|A)=0.556, and P(A|B)=0.833. This result means that if there is a negative conclusion, it is likely that the disease will not manifest. Most of the time, there will not be a false negative result. However, these results are not accurate enough to rely on in diagnostics.
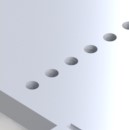
Intro to Computer-Aided Design3D Modeling Our team used the SolidWorks software to construct our new version of the Fluorimeter system. We made all of the components of the Fluorimeter system from scratch without templates. We did not have significant complications with SolidWorks because we have all used it in the past in this class and other classes. We used the linear pattern array to design the grid of holes and pegs more quickly and efficiently. Different team members designed the various components of our design and they were combined afterwards.
Feature 1: ConsumablesOur kit will not include any redesigned consumables, since all of our alterations were in the Fluorimeter. Our kit does not include any of the consumables needed for the PCR reaction itself. All consumables are standard size, because none of our redesigned components require altered consumables. Our kit includes 25 glass slides, one box of micropipette tips, 10 milliliters of SYBR Green solution, 10 milliliters of buffer solution, a micropipette, and 50 test tubes. These should be all of the materials needed for the Fluorimeter part of the lab.
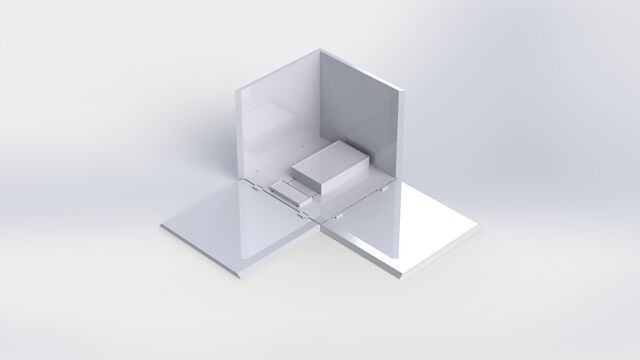
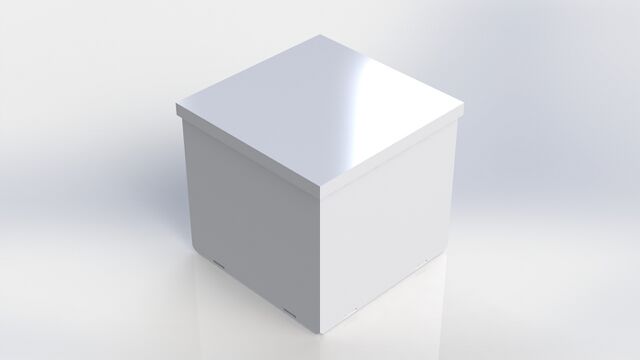
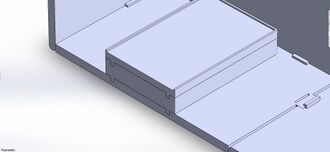
Feature 2: Hardware - PCR Machine & FluorimeterThe Open PCR machine used with our kit will be the standard version that is currently used. Our Fluorimeter system is the redesigned component. The Fluorimeter will include the pegboard base with holes in it. The sides will snap in place, so they can either be attached or remain separate. The sides can be locked down in either a flat or upright position. The lid is removable. Our kit also includes the UV box, with pegs in it to attach to the base. The phone stand also has pegs on the bottom. There are additional stackable bases included, which have pegs on the bottom and holes on the top to adjust the height of either the UV box or phone stand as needed.
Our Fluorimeter is redesigned to produce more consistent results. A problem with the current system was that the slides couldn't be changed without lifting up the entire box. Our lid is removable, so the slides can easily be switched out from above. Another problem our Fluorimeter addresses is that the phone needs to be positioned in the same spot relative to the UV light box for every picture. Rather than having to carefully record the position of both the phone and the UV box, our design allows them both to snap into place on a pegboard. They are also adjustable, depending on the desired distance between them. The third problem our Fluorimeter solves is the height difference between the phone stand and the UV box. Our supports snap into place for stability and height adjustment.
| ||||


