BISC209/S13: Lab3
Whole Community Level Analyses of Richness & Co-operative & Competitive Behavior in a Soil Microbial Community
Co-operation & Competition - community level
Because each type of bacteria in a soil community fills a unique niche and may play a slightly different role in nutrient cycling or contributing to soil structure, it is important to identify group members and to study them individually, when possible. However, it is equally important to study the cumulative functionality of the community.
The culture-dependent work at the soil microbial community level that we will set up today will have the goal of studying richness as functional metabolic diversity and as co-operative & competitive community behavior. Microbial members of a soil community must both exploit and provide resources for the community in order for such an enormous number of individuals to survive and thrive. This balanced co-operation and competion requires diversity in metabolic capabilities. Soil microorganisms demonstrate extreme diversity in their abilities to alter raw materials into useable nutrients. Bacterial communities can be thought of as functional units comprising the sum of the metabolic properties of its members. Functional diversity in substrate utilization for both the anabolic and catabolic parts of their metabolism is of great importance, particularly if one is concerned about the long-term health of a habitat or soil community.
One of the reasons bacteria can exist in large numbers in a small area is because all of them might not compete for the same raw materials. A soil community can work co-operatively to share the “work” of processing available raw materials into forms that other members can use. Keep in mind that not all microbes synthesize the same metabolic enzymes; the enzymes a microbe makes often controls which nutrients a soil community member can use or process. Because soil bacteria and fungi are the microorganisms largely responsible for the turnover of plant material, changes in the numbers of these microorganisms can be related to changes in the organic matter content of soil and affect other non-microbial members of an ecosystem or habitat.
The soil bacterial community is interdependent on its bacterial members AND on its extensive and crucial interactions with eukaryotic members of the environment, particularly in the rhizosphere: the soil that is in contact with plant roots. Rhizosphere microbes promote plant growth and vice versa.
Today you will use a community level culture-dependent method of quantifying bacteria performing important functional roles for their soil community.
To begin your work assessing microbial diversity and abundance at the community level, you will need to acquire another soil sample.
All bacteria require a source of carbon rich "food" and heterotrophic bacteria require it from organic compounds because they are unable to make carbon-carbon bonds. In a crowded soil community with millions of members competing from available organic materials to supply their carbon needs, it is advantageous to be able to use sources that are not useable by other members of the community or to be able metabolize a wide variety of carbon sources to allow survival when common sources become depleted or are unavailable. Diversity in carbon source utilization allows competition for carbon to become a co-operative strategy in the soil microbial community as a whole.
Make another Soil Extract and Serial Dilution
You will prepare another soil extract today from a new soil sample so that you can set up some tests for the prevalence of specific exoenzymes that have an important impact on the availability of nutrients for the soil community. You will start some measurements of metabolite cycling and utilization. We will assess, specifically, at the community level, how well your soil microbes interact co-operatively to use a variety of carbon sources, and to process or digest phosphates, cellulose, and starch.
Our goal is to obtain quantitative evidence for richness of the microbial soil community--- more specifically, to assess functional metabolic diversity. Specifically, we will quantify this soil microbial community's ability to use a variety of carbon sources for its anabolic needs and find out what proportion of the microbes in the community can process phosphates into a soluble form and/or degrade cellulose and starch into simpler raw materials?
Soil Extract Preparation:(one extract made for each site. Prepare a dilution series in pairs)
- Using a freshly collected and sieved soil sample collected prior to lab process the soil as you did in lab 1. Weigh 1 gram of sieved soil using the top loading balance and add it to 100 mL of sterile water which you will find premeasured for you in a sterile flask on your bench.
- Swirl to mix--- don't use the magnetic stirrer yet.
- Pour this soil suspension into a clean blender jar. Use gloves when you place the cap on the jar, first making sure that the rubber gasket is properly positioned and the seal at the bottom is tight (otherwise it will leak!).
- Blend for 3 pulses of 10 seconds on and 10 seconds off.
- Pour all of the suspension back into the flask and add a sterile magnetic stir bar (on your bench).
- Place the flask on a magnetic stirrer at medium speed and mix for at least 15 min.
- Stop the stirring and let the soil settle until the larger particulate matter settles to the bottom. Not all visible particles need to settle, just the big stuff.
- Pour off about half of the supernatant (avoiding transferring the settled particles) into a new, labeled, sterile 50 ml conical tube. In making this extract, you have created a 10-2 or 1/100 dilution. This extract can also be described as a 1% (wt/vol) solution since there is 1 gram/100ml.
Serial dilutions: (Each pair should make a dilution series using the soil extract for the site).
Each pair will prepare a series of dilutions to use in the community physiology profiling analyses that we will set up today.
- 3 large (18 X 100), sterile tubes with caps that can hold a volume of 10 ml and not spill it when vortexed
- 3 1ml sterile, disposable pipets and a blue pipet pump
- 1 10ml sterile, disposable pipet and a green pipet pump
- P1000 micropipet and sterile tips
- Bottle of sterile water
1. Label three large sterile tubes 10-3, 10-4, and 10-5.
2. Pipet 9 ml of sterile water into each tube using a 10ml sterile, disposable serologic pipet. (You may use the same sterile 10 ml pipet for all of the tubes if asepsis is maintained.)
3. Using a different sterile, disposable 1ml serologic pipet for each transfer, transfer 1ml of the 1% soil extract (1:100 dilution made of 1gram of soil) to the tube labeled 10-3; mix well by vortexing.
4. Using a new pipet, transfer 1ml of the 10-3 dilution to the tube labeled 10-4. Mix well. (Mixing 1ml of the 10-3 dilution with 9ml of sterile water makes a 10-4 dilution. )
5. Continue to transfer 1ml aliquots (after mixing well) from each dilution to the next dilution tube of water until you have carried the dilution to 10-5.
- Prevalence of Exoenzyme producers able to digest Starch, Cellulose, and/or solubilize Phosphate
- Community Carbon Source Utilization Pattern and calculation of Community Metabolic Diversity in Carbon Source Utilization
Community Physiological Profile of Starch Digesters, Cellulolytic Bacteria, and Phosphate Solubilizing Bacteria: Background
Degradation of complex carbon containing materials such as leaves and other plant matter provides an important source of a wide range of organic molecules to heterotrophic members of a soil community. Cellulose and starch are two complex carbohydrates that can be important sources of carbon, if broken down to a simpler, useable form. Many, but not all, soil bacteria contain the enzymes necessary to play this important role. It is not surprising that bacteria and other microbes are able to digest molecules associated with plants since plant roots are always present in the soil and plant parts become part of the soil litter that adds organic matter.
Starch Hydrolysis: Starch is a common plant storage compound. It is a complex polysaccharide carbohydrate of sugar (glucose) molecules joined by glycosidic bonds. If the hydrolytic exoenzyme amylase is produced, the starch in the medium will be degraded. Microbes capable of degrading starch extracellularly to molecules small enough to be taken up by the cell can use the mono or disaccharide products of starch digestion to produce energy (ATP).
Cellulolytic Activity: Cellulose is an organic compound with the chemical formula (C6H10O5)n. It is a polysaccharide consisting of several hundred to over ten thousand linear, linked β(1,4) D-glucose units. Cellulose is a primary structural component of the cell wall of green plants, many forms of algae and some other types of organisms. Some species of bacteria secrete cellulose to form biofilms. Cellulose is the most common organic compound on Earth comprising 40 to 60% of plant residues.
Some animals can digest cellulose with the help of symbiotic microorganisms that live in their guts. For example some termites contain flagellate protozoa in their hind guts that produce cellulases while other termites and cows rely on gut bacteria. Fungi are very good at breaking down cellulose, just consider the shelf mushrooms that help degrade fallen trees. Humans can digest cellulose to some extent, but cellulose consumed by humans as food is largely undigested and acts as a hydrophilic bulking agent for feces ("dietary fiber"). Soil microorganisms capable of catabolizing cellulosic material contribute to the carbon cycle and, ultimately, contribute to the release of CO2to the atmosphere--- making it available for re-uptake by plants. Cellulolysis is the process of hydrolytic break down of cellulose into smaller polysaccharides called cellodextrins or complete break down into glucose units. Because cellulose has a somewhat complex structure, cellulolysis is relatively difficult compared to the breakdown of other polysaccharides. The enzymes used to cleave the glycosidic linkage in cellulose are glycoside hydrolases. They include endo-acting cellulases and exo-acting glucosidases. Such enzymes are usually secreted as part of multienzyme complexes. Soil bacteria and symbiotic anaerobic bacteria (like the Cellulomonas group of bacteria) are among those known to produce these enzymes.
Phosphate Solubilizing Activity: Phosphorus is one of the major nutrients that limits plant growth. It is important in physiological activities such as photosynthesis, root development, cell division, and for efficient use of carbon substrates. Most phosphorus is found in an insoluble form; thus, the conversion of insoluble phosphorus into soluble forms that can be absorbed by plants is an important interaction between plants and phosphate solubilizing bacteria.
Because soil is, in some ways, a non-renewable resource, the activity of the microbial population in maintaining soil quality is of paramount importance and a diverse and rich population of phosphate solubilizing bacteria play a crucial role in the improvement and repair of soil health destroyed by years of environmental abuse.
Community EXOENZYME Prevalence:
Activities:
Nutrient Agar comparison control
Starch hydrolysis prevalence
Cellulose digestion prevalence
Phosphate Solubilizing prevalence
Protocol for all exoenzyme prevalence assays:
Refer to your standard plate count calculations (Lab 2). You will use the dilution that gave you 30-300 CFUs when you evaluated your plate count in Lab2 AND one dilution higher and one dilution lower. Use those 3 dilutions to inoculate the media described below. Using three dilutions (with 2 replicates for each dilution) will ensure that at least one dilution of each medium will have colonies of the appropriate density to be accurately counted and evaluated next week.
1. Colony Count on Nutrient Agar (NA) General Purpose Medium as a Control
(0.3% Beef extract, 0.5% Peptone, 1.5% Agar at pH 6.6- 7.0 at 25°C) is used to determine comparative number of total culturable bacteria:
Using your P200 micropipet and sterile tips, dispense 100µl of the appropriate soil extract dilution onto each of two pre-labeled Nutrient agar plates. Use a sterile, disposable spreader to evenly distribute the diluted soil extract all over each culture plate. Repeat for the other two appropriate dilutions. Incubate all the plates at RT until visible colonies have appeared. Check the cultures after 24 hours to make sure they aren't close to being overgrown and again at 72 hours. Move the culture plates to the cold room before they become overgrown. Continue to check your plates every few days until you transfer them to the cold room. Your goal is to have between 30-300 countable colonies on one of the dilutions.
ANALYSIS in LAB 4:
Choose the dilution that has betweeen 30-300 colonies, and count the colonies on the two replicates. Record this number on the plate (so that your teammates don't have to repeat your work) as well as in your lab notebook. Then calculate cfu/g wet soil. Refer to the calculation explanation in LABS 1 and 2. How did your count on this soil extract compare to the count made in Lab 2 from a different soil sample at the same location? Should they be relatively the same? Are they? You will use the calculation on the new soil sample for your calculations of the prevalence of starch and cellulose digestors, and for the phosphate solubilizers in the community.
2. Starch Medium (2.5%(wt/vol) soluble starch in Nutrient Agar) is used to determine the % of amalyase producing, starch digesting culturable microbes when compared to the total number counted in NA:
Using your P200 micropipet and sterile tips, dispense 100µl of one of the soil extract dilutions into the center of each pre-labeled starch agar plate at the appropriate dilutions. Choose the dilution that is expected to result in 30-300 cfu/g soil. Use a sterile, disposable spreader to evenly distribute the extract aliquot. Repeat for a soil extract dilution that is 10 fold more and one 10 fold less dilute. Incubate all plates at RT until mature, visible colonies appear. Move the culture plates to the cold room before they become overgrown.
ANALYSIS in LAB 4:
Choose the dilution that shows 30-300 colonies. Flood the replicate plates with Grams Iodine. Let the plate sit for at least 10 minutes, longer is fine. The plate should turn dark blue as the iodine binds to the starch; Pour off the excess iodine (into paper towels in the biohazard bag on your bench) and wait until the remaining liquid is absorbed by the plate. Count the colonies that show a clear halo, indicating the starch in the medium was digested by amylase secreted from the bacteria in the colony. Count the number of colonies that are able to digest starch (clear zone around the colony). To calculate the % of culturable microbes able to digest starch/CFU in a gram of wet soil you will use the Average total number of colonies calculated from your NA plate count. Make sure that both counts were made on the same dilution. If not, you will have to do a conversion.
Reference: Beishir, Lois. 1996. Microbiology in Practice 6th ed. HarperCollins Publishers Inc. New York. Module 33: 301-306.
3. Cellulose Congo Red Agar Medium is used to determine the % of cellulolytic microbes (those producing cellulase and able to digest cellulose)
Using your P200 micropipet and sterile tips, dispense 100µl of one of the soil extract dilutions into the center of each of the pre-labeled cellulose congo red agar replicate plates. Choose the dilution that is expected to result in 30-300 cfu/g soil. Use a sterile, disposable spreader to evenly distribute the extract aliquot. Repeat for a soil extract dilution that is 10 fold more and one 10 fold less dilute. The ashed, acid-washed cellulose and the Congo red in the medium will allow enumeration of cellulose-digesting bacteria in soil. Incubate all plates at RT until mature, visible colonies appear. Move the culture plates to the cold room before they become overgrown.
ANALYSIS in LAB 4:
Choose the dilution that shows 30-300 colonies. Count the colonies on the replicate plates that show a clear halo, indicating the cellulose in the medium was digested by cellulase secreted from the bacteria in the colony. The red color of the medium provides increased contrast between the cellulose containing medium and the halo or clear zone that indicates that cellulase has diffused out of bacterial producers and degraded the cellulose in the immediate vicinity. Count the number of colonies on the plate that are able to digest cellulose (clear zone around the colony). To calculate the % of cellulolytic microbes/CFU in a gram of wet soil you will use the total number of colonies calculated from your NA plate count. Make sure that both counts were made on the same dilution. If not, you will have to do a conversion.
Cellulose Congo Red Agar:
0.05% K2HPO4; 0.025% MgSo4; 0.188% ashed, acid washed cellulose powder; 0.02% Congo red, 1.0% Noble Agar, 0.2% gelatin, 10%(vol/vol) sterile soil extract(10.5% air-dried, sieved soil that's autoclaved twice, allowed to settle, and the supernatant filtered); final pH 7.0 - 8.0.
Reference: Hendricks, C.W., Doyle, J.D., Hugley, B. (1995) A new solid medium for enumerating cellulose-utilizing bacteria in soil. Applied and Environmental Microbiology 61, 2016-2010.
4. Phosphate Medium (Pidovskaya medium [PVK]) is used to determine the % phosphate solubilizing microbes (those producing phosphatases) in a soil community:
Using your P200 micropipet and sterile tips, dispense 100µl of one of the soil extract dilutions into the center of the two pre-labeled Phosphate medium (PVK) replicate plates. Choose the dilution that is expected to result in 30-300 cfu/g soil. Use a sterile, disposable spreader to evenly distribute the extract aliquot. Repeat for a soil extract dilution that is 10 fold more and one 10 fold less dilute. Incubate all plates at RT until mature, visible colonies appear. Move the culture plates to the cold room before they become overgrown.
ANALYSIS in LAB 4:
Choose the dilution that shows 30-300 colonies. Count the colonies that show a clear halo on each of the replicate plates, indicating the phosphate in the medium was solubilized and processed by enzymes secreted from the bacteria in the colony. Count the number of colonies that are able to solubilize phosphate (clear zone around the colony). To calculate the % of culturable, phosphate solubilizing microbes /CFU in a gram of wet soil you will use the total number of colonies calculated from your NA plate count. Make sure that both counts were made on the same dilution. If not, you will have to do a conversion.
Pidovskaya Medium Modified (Nautiyal, 1999)
1% glucose; 0.5% Calcium Phosphate [Ca3(PO4)2; 1% MgCl2.6H2O; 0.25% Magnesium Sulfate (MgSO4.7H20);0.2% (NH4)2SO4; 0.25% KCL; 0.0025% BromoPhenol Blue; 1.5-2% agar
References: Pikovskaya, R.I. 1948. Mobilization of phosphorus in soil in connection with the vital activity of some microbial species. Microbiologia 17, 362-370>
Pranjal Baruah (2007)Isolation of phosphate solubilizing bacteria from soil and its activity. Available at: Biotechindia.files.wordpress.com/2007/12/isolation.pdf.
Community Carbon Source Utilization Profiling:
Carbon Source Utilization
One type of metabolic diversity that we will assess in our investigation is physiological diversity in carbon source utilization.
You have learned in other courses about the importance of carbon fixation by autotrophic photosynthetic plants. The inability to make carbon-carbon bonds and, therefore, to utilize carbon dioxide as a carbon source is problematic for heterotrophic species including humans and all other animals. Fortunately there are bacteria that, like plants, are autotrophic and photosynthetic, although many others are heterotrophic, like us. Unlike us, however, bacteria are extremely diverse in the types of carbon sources they can use metabolically. Soil bacterial communities both compete and co-operate in utilization of available sources of essential, useable carbon. The health and longevity of the community is dependent on a continuous supply of useable carbon for all its members. Your investigation on community carbon source profiling will attempt to quantify some of that co-operation and competition.
Carbon source patterns using BIOLOG™ Community Level Physiological Profiling (CLPP)
Observing patterns of substrate utilization can provide evidence of functional diversity of a microbial community. Additionally, understanding how metabolic substrates can be used in soil communities can help us understand the stability or flexibility of an ecosystem. Carbon sources are crucial anabolic raw materials for heterotrophic microbial growth. Microbes vary enormously in their ability to make use of carbon in different forms. Using direct inoculation of soil community samples into a variety of carbon substrates will allow us to study and measure potential community carbon source utilization and provide us with evidence for our hypothesis that soil community diversity allows co-operative as well as competitive interactions.
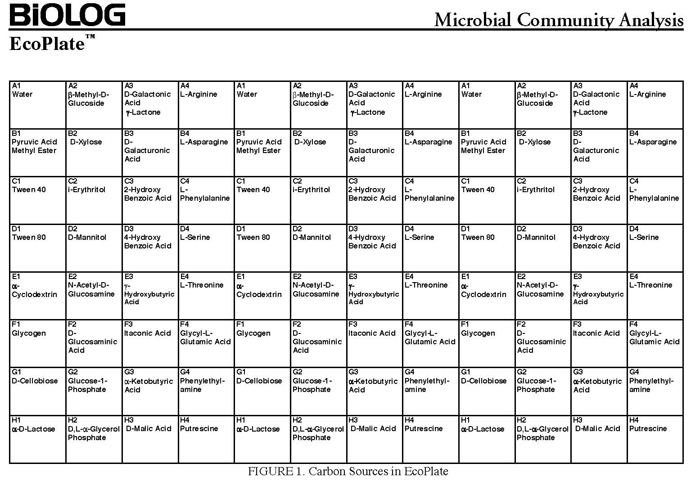
In community level physiological profiling (CLPP) the metabolic properties of individual bacteria in the community contribute to the total metabolic capacity of the community. Mixed environmental samples are inoculated directly into the single carbon source wells of microtiter plates followed by spectrometric quantification of growth. If one or more microbes in the community can use a particular carbon substrate, the metabolism of that carbon source is accompanied by a capture of electrons from water-soluble colorless Tetrazolium salts (WTS) to become reduced purple formazans. WST-1 and in particular WST-8 (2-(2-methoxy-4-nitrophenyl)-3-(4-nitrophenyl)-5-(2,4-disulfophenyl)-2H-tetrazolium (MTT), are reduced outside of the cells. They combine with an electron mediator (phenazine methosulfate (PMS)), to yield a water-soluble purple product called formazan that can be measured spectrophotometrically at 590nm. The color development is additive and directly proportional to the metabolism of each carbon source so the development of forazan can be followed over time. The intensity of purple color as a pattern in the wells is used to determine a characteristic reaction pattern classed a metabolic footprint. We will use the patterns to determine community metabolic diversity (CMD). For these measurements to be meaningful, it is important to control for number of microbes, incubation time, and other microenvironmental factors as well as the requirement for saturating substrate and indicator concentrations. There are 31 carbon sources available on a BIOLOG plate. This set of substrates is far from exhaustive. However, these substrates were chosen for variety and to simulate the range of carbon sources commonly found in the soil, either from root exudates or from decomposition of organic molecules.
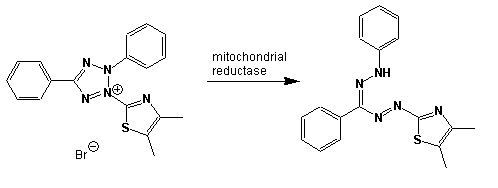
Scheme showing the reduction of MTT to formazan. Image created by Jenpen 21 September 2006
Source http://en.wikipedia.org/wiki/File:Mttscheme.png . Public domain use per Wikipedia Commons.
Colorless (2-(2-methoxy-4-nitrophenyl)-3-(4-nitrophenyl)-5-(2,4-disulfophenyl)-2H-tetrazolium) is reduced to purple formazan
The BIOLOG-ECO™ 96 well plates we will use contain 3 replicates of 31 carbon sources and three water control wells. Most of these substrates are commonly associated with plant root exudates and, thus, are likely to be available to your soil community. The method for community carbon source profiling that we are using is simple and rapid, but its interpretation must be carefully evaluated, recognizing that the methodology is imperfect. The following studies discuss issues and limitations of CLPP (community level physiological profiles) analysis.
These or similar references are provided in the lab Sakai site as .pdf files.
References and Resources: Biolog Carbon Source
• Garland, J.L., Mills, A.L. (1991) Classification and characterization of heterotrophic microbial communities on the basis of patterns of community-level-sole-carbon-source-utilization. Appl Environ Microbiol 57, 2351–2359.
• Garland, J.L. (1997) Analysis and interpretation of community-level physiological profiles in microbialecology. FEMS Microbiol Ecol 24, 289–300.
• Preston-Mafham, J., Boddy, l., Randerson, P.F. (2002) Analysis of microbial community functional diversity using sole carbon source utilization profiles-a critique. FEMS Microbiology Ecology. 42, 1-14.
BIOLOG Redox Dye Mix Brochure JUL07. http://www.biolog.com/mID_product.shtml.
PROTOCOL:
Carbon source utilization patterns using BIOLOG™ Community Level Physiological Profiling (CLPP)
- 10mM phosphate buffer (sterile, pH 7)
- P200 and P1000 micropipets with sterile tips
- Multichannel pipet (set to deliver 100 µl) and sterile tips
- BIOLOG EcoPlate™
- sterile plastic multichannel reservoir
- Wear gloves throughout the entire protocol
- Do not cross contaminate your samples or the solutions
- Keep your work area clean: freshly disinfect your bench top before beginning
- Do not use a vortex at any point in this protocol unless it is specified that you should do so.
1. Use sterile serological pipets to make 12 mls of the appropriate dilution (for greenhouse soil make 12ml of 10-4 dilution). Our goal is to end up with about 105 cfu in each well, this is an estimate that does not account for those organisms that did not grow on NA, but might grow in this community assay. For example, if you counted roughly 50-100 colonies on your 10-4 dilution plates on your dNA enumeration plates, you would need to make 12mls of a 10-4 dilution). You will accomplish this by pipetting 10.8 mL of 10mM phosphate buffer into a large sterile tube and adding 1.2 mL from your 10-3 soil extract serial dilution tube. You need 12 ml of diluted soil extract to inoculate all the wells of a BIOLOG™ECO plate (10 ml for the plate and 2 ml extra.
2. If you will be using a multichannel micropipet, pour this 12ml of diluted soil extract (106 cfu/ml) into a sterile reservoir (a petri dish or a v-shaped plastic reservoir). If the multichannel pipet is unavailable, forget pouring the soil extract dilution into a reservoir. You can use your P200 to dispense individual aliquots directly into each well of the BioLog plate as described in the next step.
4. Be careful to preserve the BIOLOG Eco™ plate's and its cover's sterility (eg. don't place it face down on your bench). Remove the cover and transfer 100µl of the soil extract dilution into each each well of the 96 well BIOLOG plate. Check visually the consistency of the amount of diluted extract in the micropipet tips after you have drawn up your aliquots to determine that you have no bubbles and that the quantity to be dispensed is the same. If the pipet tips appear unevenly filled or you have bubbles, do not dispense the inoculum into the wells! Start over. If you are unfamiliar with the use of multichannel pipets, ask your instructor to observe your technique.
5. Add 50μL of phosphate buffered saline (PBS) to each well (to account for dehydration over time of measurement). Note that this dilution does not change the number of cfus per well (105 cfus), but it does change the overall concentration of your soil microbes in this assay.
6. Replace the cover of the plate and label one side of the cover. DO NOT LABEL ON the top or bottom to avoid interference in the light passage during spectrophotometric readings. Use a piece of your team color tape and include your initials, lab section, date, and soil sample code.
7. Take a time 0 reading at A590nm using the Spectramax340PC384 plate reader as described in the next section of these instructions.
8. After each reading, place your covered plate in a plastic container with moist paper towels and incubate it at room temp (~22C) in the location assigned for your lab section.
MEASURING MICROBIAL GROWTH AS A590nm
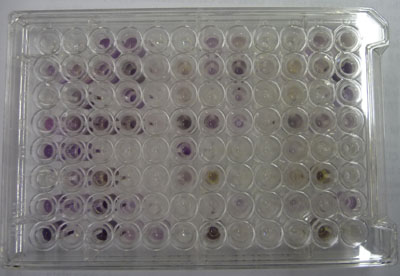
The intensity of color change is monitored in each of the wells by taking spectrophotometer readings once a day at A590nm. With your instructor, You and your partners should figure out a schedule to divide up the work of collecting these data until a peak absorbance is reached on more than 2 consecutive readings, this will likely require daily readings for a week. You must not miss more than 1 consecutive day. Make sure that you take a photo of your plate against a white background on the final day of measurement.
In 2013 we will not use the MolecularDevices SpectraMax 340PC, instead we will use MolecularDevices SpectraMaxM3 and SoftMax®Pro5 software.
Time 0: Use the SpectraMax 340PC 384 spectrophotometer (with a microplate reader) found in the Microbiology lab (L302). You will measure absorbance as A590nm. Follow the directions for setting up the instrument and software and for exporting the data to Excel spreadsheets found in the next section:
Using the SpectraMax 340PC384 Microplate Spectrophotometer and SoftMax Pro version 4.0™ software
Spectramax 340PC :
Molecular Devices Spectramax 340PC instructions
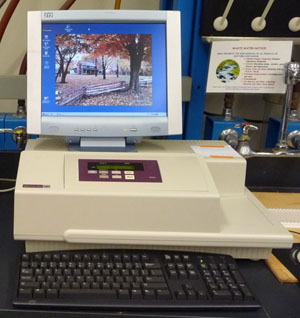
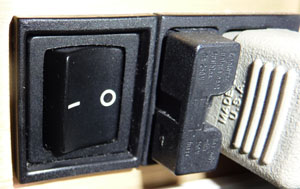
Turn on the Spectramax 340PC spectrophotometer using the switch located next to the plug in the back on the right hand side (as you face the spec). The drawer will open. The drawer may, or may not, close on its own. If it doesn't, close it by pressing, once, the DRAWER button found on the Spectramax control panel (pictured in purple on the instrument photo below). It is important to keep the drawer closed as much as possible to prevent dust from entering the spectrophotometer. The machine will automatically start a required calibration. Allow up to 10 minutes for the Spectamax340PC to warm up after the calibration and BEFORE you attempt to insert your plate.
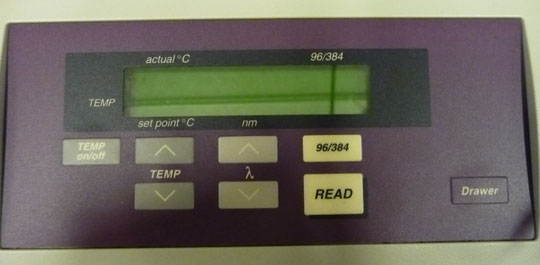
The computer should be on. (If not, turn it on using the on/off switch on the processor on the floor).
After the spectrophotometer finishes its start-up calibration, the drawer will open. If it doesn’t close on its own, close it by pushing ONCE the “drawer” button on the face of the spectrophotometer.
When the warm up period is over, double click on the SOFTmaxPRO4.0 shortcut on the desktop of the computer. An “untitled” document will open on the computer screen called Default Tutorial 1.
The draw may open again, or you can open it manually by pushing the DRAWER button ONCE. (Drawer button is found on the Spectramax control panel--as pictured in purple on the instrument photo above.)
Position your 96 well plate into the tray drawer so that it fits securely in the holder and the well A1 is to the top left. Close it using the DRAWER button .
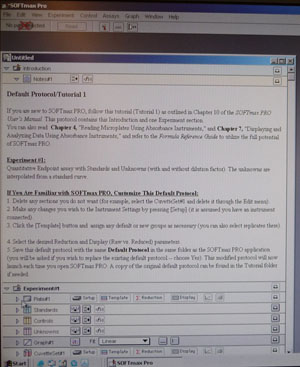
Double Click the setup button located beside Experiment 1:
![]()
Plate #1 . set up
A new window will open called Instrument Settings. The icon ENDPOINT will be active.
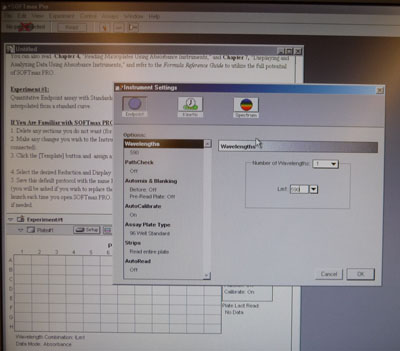
Set the correct wavelength (590nm for our Biolog®: carbon source plates). Click OK
You will see a table representing a 96 well plate under EXPERIMENT #1. The spec is ready to read all the wells in a 96 well plate.
In the upper toolbar menu at the top of the screen click READ.
Troubleshooting: If the READ button is gray and won’t let you start the read, check for a red X over the PORT SERIES icon to the left of the READ button. It indicates NO PORT SELECTED. If so, click on this icon and select series port: COM 2 from the drop down menu. Click OK. (The drawer may open and you will need to close it).
You will hear the spectrophotometer slit lamp passing over the plate to "read" it, meaning that it is measuring absorbance at the nm wavelength best for detecting purple colored pigments (590nm). The purple color formation is a function of the total redox reactions that occurred in the well as the microbes use each carbon source metabolicaly and change the colorless form of the dye, 5-cyano-2,3,-ditolyl tetrazolium chloride (CTC), to a purple- colored product.
The drawer will open when the readings are completed. Remove your plate and CLOSE the drawer using the DRAWER button on the face of the spectrophotometer. It is important to keep the drawer closed as much as possible to prevent dust from entering the internal parts of the machine.
A new screen will appear with your recorded data in a 96 well template.
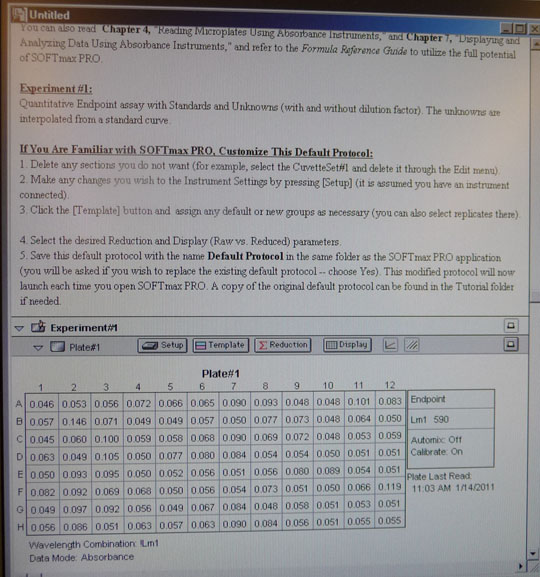
As a safety precaution, immediately export these data on the computer desktop to the BISC folder for your lab section. Use File: Import/Export: Export . Be sure to label the file with your soil sample code and day of reading.
Now save the data in EXCEL: HIGHLIGHT and COPY all the data in the 96 well template.
Open a new Excel spreadsheet by clicking Start: Programs: Excel
Paste the data from the 96 well template: EDIT: PASTE SPECIAL: TEXT into the Excel spreadsheet. This is a very important step because it aligns the cells properly.
Label the wells in the spreadsheet A-H and 1-12.
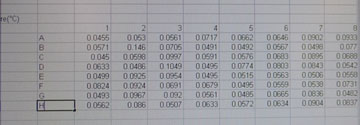
Add identifying information to the worksheet title including: Biolog/590nm: Date, Soil Sample ID code: Group color and Lab Day.
Click Save As and rename the file with your group’s soil sample code and lab day.
Close the Spectromax software. DON'T SAVE! (You have already saved and exported adequately.)
Because the instrument computer is not networked, you will have to Save the excel spreadsheet to a FLASH DRIVE. If you don't have your own, there should be one in the USB port in the front of the computer processor (found on the floor under and to the left of the spectrophotometer). This one is provided for all BISC209 students. If the flash drive is missing, look to see if the last user left it connected to the Mac computer on the Instructor’s bench. If it is not there, you will have to send a message to the class through Forums in Sakai to see if someone took it home by mistake and email your instructor.
If you have a flash drive available, open Excel and use the FILE drop down menu to SAVE AS: (provide an identifying title with your soil sample code letter and your team color and lab day) and SAVE TO REMOVABLE DISK (E), BISC 209-2011 folder: Lab section (TUES OR WED) folder.
To remove a Flash Drive from a PC: Close the Excel document, you created, and click on the icon with a green arrow in the far right of the toolbar. A new screen will open “Unplug or eject hardware”. Click stop. In the “stop a hardware device” screen, highlight “generic volume device : E”. Click OK. The final screen tells you that it is safe to remove device. Click OK and Remove the Flash Drive from the computer.
Now post your data in the google doc-linked through our lab SAKAI site. The file is called: BIOLOG-CMD_calc&GraphTEMPLATE_2012: To do this:
Take the Flash drive over to the Instructor’s Mac computer at the front of the lab and insert the flashdrive.
You will see an image appear on the desktop of the Mac.
Click to open it and find your data.
Save the daily data in to a folder for your soil sampling site on the desktop AND post it to a google spread sheet found in the Data folder in Resources in SAKAI
When you have saved, drag the FLASHDRIVE icon to the TRASH and wait for it to disappear from the desktop.
REMOVE THE FLASH-DRIVE from the Instructor computer AND RETURN IT TO THE USB PORT ON THE SPECTROMAX PROCESSOR WHERE YOU FOUND IT!!!
Turn off the SPECTROMAX instrument using the on/off switch on the back of the computer.
DO NOT turn off the computer but do close all the open windows.
PRECAUTION: If you haven’t saved your data and another group reads their plate, your data will be overwritten and lost.
DATA COLLECTION
We have provided you with a spreadsheet called BIOLOG-CMD_calc&GraphTEMPLATE_2013_Tues_siteA (or B, or C, and _Wed_siteD, or E, or F) You will find this spreadsheet on a thumb drive. Please follow your instructor's adivice about how to insert your daily data after each reading into this template. You will have to carefully copy and paste the day's absorbance readings to the template. Be sure to use the correct one for your team! It is crucially important that you align the right carbon source to its value (don't forget water) and get the right well numbers transferred to the appropriate position on the Worksheet DAY (1, 2,etc) in the template workbook. Note that the Template contains a separate worksheet (tabs on the bottom) for each day within the full workbook. Make sure that you fill out the appropriate day (DAY 0, 1, 2 etc). If you miss a day, leave that page blank.
The Google Doc is pre-formatted with the calculations for these data. It includes the formulas to average replicate measurements each day and it will automatically subtract the background (readings in the water wells). There is a normalization for background that will be subtracted automatically (this threshold absorbance is 0.25 for each carbon source). We hope that including these pre-made calculations in the template will make your calculation of community metabolic diversity (CMD) and the data analysis of carbon source utilization patterns relatively uncomplicated. Please make sure you understand the EXCEL performed calculations. When you are sure that your data has been copied correctly into the appropriate template day, you will notice that the built in calculations will provide a final average absorbance reading for each substrate.
Fill in the last column labled: SCORE 1 for wells with OD above 0.0. Once you fill in this final column, the template will calculate the total number of positive wells out of 31 for you and the SUM will appear in a cell below your data. This is the CMD for that day.
Copy this number and use paste special to paste the value next to the appropriate day in the table on the last TAB of the workbook (CMDtable&graph).
GRAPHING THE CMD DATA:
The graph of our community metabolic diversity(CMD) is built into the last page of the Workbook template: You will observe this figure for the calculated soil sample's CMD values on the y axis versus time on the x. It provide a sense of the time frame for the community to begin using the carbon sources and by day 7 how many different sources out of 31 were used: The community functional metabolic richness in carbon source utilization. What is important about this graph in providing evidence for our hypothesis that a soil microbial community must be able to utilize a wide variety of carbon sources to support and maintain its abundance?
What else can we learn from assessing Community Metabolic diversity (CMD)
CMD is calculated by summing the number of positive responses (wells with a positive A595nm value after all the corrections) at each incubation time. CMD is a simple way to represent the total number of substrates able to be effectively metabolized by the microbial community. It's a measure of diversity in use of carbon sources but it does not identify the carbon substrates or help us find a pattern of preferred substrates.
Carbon source utilization pattern:
Since CMD analysis does not provide specific information about the pattern of carbon substrates used in your soil community, how could you examine the pattern of use of carbon sources? You could plot on a column graph the average A590nm absorbance of the three replicates (with error bars) on the final day of data collection on the y axis and the 31 different carbon sources on the x axis in one figure. (Remember that there is no such thing as a negative value for Absorbance so count anything that is less than zero as zero. Why might you seem to have a negative value?). Should you arrange those carbon sources in the order they are on the BIOLOG plate or is there a better way to organize them on your graph to show your main message(s)? What kind of information do you need in the figure legend?
Can you think of other ways to illustrate functional metabolic diversity in your soil community?
Continue Isolation of Bacteria to Pure Culture as Examples of Soil Community Richness and Co-operative and Competitive Behavior
Continue to attempt to isolate to pure culture examples of your soil community membership. Directions are found in the Protocols section of the wiki at Culture Media: General Purpose, Selective, Enrichment, Differential, & Assessment of Digestive Exo-Enzymes
Directions for Streaking for Isolation onto new solid media is found at Streaking for Isolation
Coordinate with your partners to try to isolate colonies that look different from each other. Your goal is for each student to end up with 4 pure cultures of DIFFERENT genera of bacteria from as many groups as possible.
Once you believe you have pure isolates, continue to subculture to fresh NA plates each week. After the initial selection it is not necessary to maintain your isolates on enrichment/selective media. Once they are separated from their competitors we should be able to maintain them on an all-purpose medium such as NA. If you "lose" a culture when you move from enrichment/selective media to NA, you should be able to go back to the previous culture and recover it on a new plate of enrichment/selective medium IF you didn't use the whole colony in making the previous transfer and your saved your previous culture in the refrigerator. In subsequent labs you will make a bacterial smear and do a Gram stain and start other tests to explore the physical and metabolic characteristics of your isolates when you get them to pure culture. We will also attempt to identify them using DNA sequencing of their 16s rRNA gene.
The following information about isolation of the groups of bacteria we seek has sections that are repeated from Labs 1 and 2 because each of you may be at different points in the enrichment and isolation process.
Finding Nitrogen Fixing Bacteria such as Azotobacter
on Azotobacter Medium
Important nitrogen cycling bacteria, are able to aerobically use N2 as their source of Nitrogen without a symbiotic partner. The Azotobacter group of the nitrogen fixers can use mannitol as their sole carbon source. Could you design a culture medium that might help you select for Azotobacter nitrogen fixers and distinguish them from other nitrogen fixing bacteria?
-
Isolation:
Watch for the appearance of isolated, slimy colonies. - Continue to sub-culture by isolation streaking a well-isolated colony to new medium until you think you have a pure isolate.
To distinguish Azotobacters morphologically from other Nitrogen fixing bacteria that may grow on this medium:
Make a subculture onto NA from an isolated colony found on Azotobacter medium. Look for different kinds of colonies on nutrient agar. If there is more than one type of colony (judge by color, shape, and other visible factors) appearing on your plate, you will need to code them all separately and maintain them on separate NA plates. In a later lab you can Gram stain each different looking colony to help you decide if they are Azotobacter or other nitrogen fixers. Note that Azotobacter bacteria may not appear slimy on nutrient agar.
Finding Spore Forming Bacteria
(Such as members of genera Bacillus and of Streptomyces in the Actinomycetes family
using Glycerol Yeast Extract agar for enrichment)
- Some of the bacteria we seek are very slow growers; therefore, you should let the cultures on GYE medium incubate for longer than cultures on other media. That said, do not let the colonies that do appear overgrow if you find something interesting. Transfer an interesting, well isolated colony to fresh medium and continue to let the original plate incubate until you are sure you aren't going to get Streptomyces colonies.
- When well-isolated candidate colonies appear, use the tip of a sterile toothpick to pick up a small but visible amount of growth, being careful not to touch anything but the tip of the colony.
- Sub-culture by transfering growth with a sterile toothpick and then using your loop to isolation streaking a single colony to fresh medium. Sub-culture any interesting colonies (preferentially chose those that appear like "little volcanos" or "powdered sugar") onto new glycerol yeast plates (one colony/plate)
Actinomycetes and Streptomycetes are often tough leathery colonies, so transfer of these colonies is sometimes difficult. The powdery area may indicate spore formation: take a sample from this area, if possible. In any case, try to "break off" a piece of the colony with your sterile loop or with a sterile toothpick and transfer that piece of a colony to zone one of the new medium and then use your loop for streaking out the other zones. The tiny spores on the surface of the colony are likely to transfer to the next plate or tube when you work with it. (That's a good thing this time.)
Spore forming bacteria are highly resistant to environmental stresses and to disinfection procedures. Among these hardy bacteria are members of the genus Bacillus and the Actinomycetes group of bacteria. All of these bacteria, particularly the Actinomycetes genus Streptomyces, are important sources of antibiotics. Actinomycetes often show a uniquely recognizable filamentous and/or leathery colonial morphology [1] that will help you find them.
The genus Bacillus, a member of the Firmicutes is one genus in a large group of Gram positive organisms. Bacillus spp. are known for the ability of the vegetative cell to produce a metabolically inactive state (a spore). It is likely you will find several subgroups of Bacillus growing on general purpose media or other of the media we use. Use web images to become familiar with the colony morphology of Bacillus so that you will recognize likely candidates and choose them for isolation.
We will use oven dried soil on selective media to enrich and select for spore forming bacteria that can survive oven drying and the high osmotic pressure in our selective medium. You should try to isolate and characterize several different appearing colonies from this medium. Do some research on the web to find images of macroscopic colonies and microscopic bacteria from these groups so you will recognize them if you find them.
Glycerol Yeast Extract Agar (GYEA): a selective medium to enrich for many of the spore forming, antibiotic producing bacteria in the Actinomycetes, Bacillus, and other groups of Gram positive spore formers.
When well-isolated candidate colonies appear, use the tip of a sterile toothpick to pick up a small but visible amount of growth, being careful not to touch anything but the tip of the colony.
Identification:
Actinomycetes colonies may be slow growing, so check your plates every few days for up to 2 weeks. Bacillus spp. are often able to spread across the surface of the agar, so isolation is sometimes difficult. Check your plates often so you can find and isolate Bacillus colonies when they are still small.
Other Interesting Bacteria from Simmons Citrate, NA+ Starch, or NA media
Continue sub-culturing well-isolated colonies to new NA plates until each student in your team has a unique set of 4 bacterial members of your soil community in pure culture. Consult frequently with your soil sampling group members and compare colony appearance to increase the chance that each member of your group is isolating a unique set of bacterial members of your soil community. Make observations about colony morphology, growth habits and speed and take photos of each of your pure cultures. Maintain your isolates by sub-culturing a single colony to a new NA plate at least once a week. Compare the colony morphology of the sub-culture to the previous culture. If it changes significantly, you may have lost your original isolate. Consult with your instructor if you are worried about this at any point. Once all of us have our chosen bacteria in pure culture, we will do other tests to identify and characterize them in the hope of providing evidence for co-operative and competive community behavior.
CLEAN UP
1. All culture plates that you are finished with should be discarded in the big orange autoclave bag near the sink next to the instructor table. Ask your instructor whether or not to save stock cultures and plates with organisms that are provided.
2. Culture plates, stocks, etc. that you are not finished with should be labeled on a piece of your your team color tape. Place the labeled cultures in your lab section's designated area in the incubator, the walk-in cold room, or at room temp. in a labeled rack. If you have a stack of plates, wrap a piece of your team color tape around the whole stack.
3. Remove tape from all liquid cultures in glass tubes. Then place the glass tubes with caps in racks by the sink near the instructor's table. Do not discard the contents of the tubes.
4. Glass slides or disposable glass tubes can be discarded in the glass disposal box.
5. Make sure all contaminated, plastic, disposable, serologic pipets and used contaminated micropipet tips are in the small orange autoclave bag sitting in the plastic container on your bench.
6. If you used the microscope, clean the lenses of the microscope with lens paper, being very careful NOT to get oil residue on any of the objectives other than the oil immersion 100x objective. Move the lowest power objective into the locked viewing position, turn off the light source, wind the power cord, and cover the microscope with its dust cover before replacing the microscope in the cabinet.
7. If you used it, rinse your staining tray and leave it upside down on paper towels next to your sink.
8. Turn off the gas and remove the tube from the nozzle. Place your bunsen burner and tube in your large drawer.
9. Place all your equipment (loop, striker, sharpie, etc) including your microfuge rack, your micropipets and your micropipet tips in your small or large drawer.
10. Move your notebook and lab manual so that you can disinfect your bench thoroughly.
11. Take off your lab coat and store it in the blue cabinet with your microscope.
12. Wash your hands.
Assignment
Graded Assignment: Construct a table (with properly formatted legend) that effectively presents your experimental evidence for the abundance of microorganisms in your soil community. Write a draft results narrative to accompany your table.
Consult the full directions for this assignment found at: Lab 3 Assignment: Colony Count vs. Direct Count Enumeration
Do before next lab:
The timely submission of daily BIOLOG-workbook entries to the DATA folder for your worksite is expected.

