Alondra Vega: Week 4
From OpenWetWare
Jump to navigationJump to search
Terminology
- The Michaelis-Menten equation describes the relationship between the rate of a substrate conversion by an enzyme to the concentration of the substrate in the equation. V is the rate of conversion, [S] is the substrate concentration and Km is the Michaelis constant. Km approximates the affinity of enzyme for the substrate.
- The Lineweaver-Burk experiment shows a way of illustrating kinetic date. The plot is produced by taking the reciprocal of the Michaelis-Menten equation. It will usually produce a linear function y = mx + b.
- A chemostat reaction deals with the flow rate into the system and the flow rate out of the system. A mathematical model is used (a set of differential equations) to see the change in the steady state, or to find what the steady state is.
- Exponential growth (including exponential decay) occurs when the growth rate of a mathematical function is proportional to the function's current value. It will produce a similar curve to ex when plotted.
Applying Michaelis-Menten Model
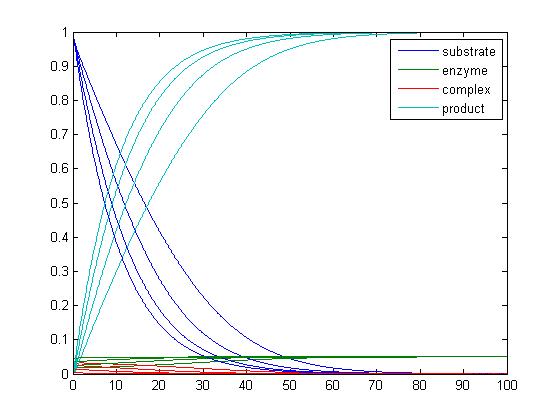
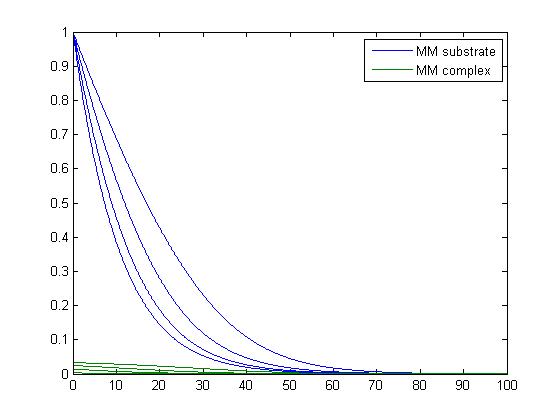
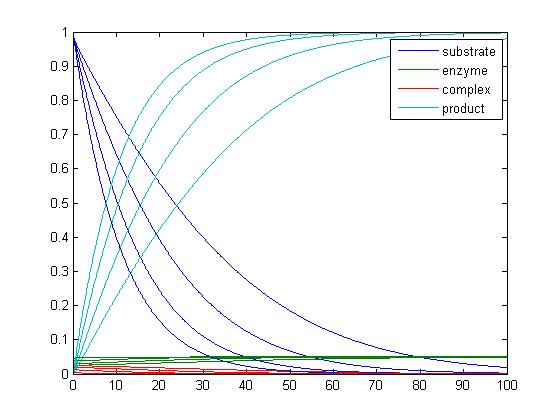
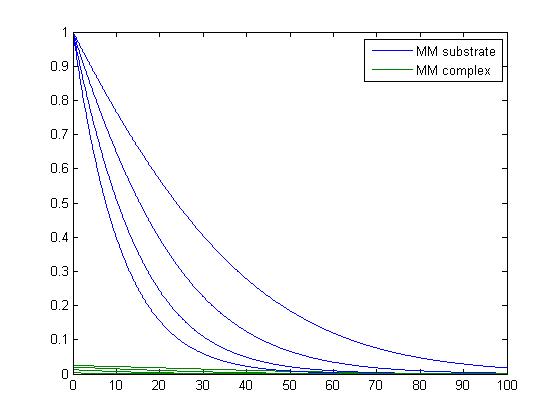
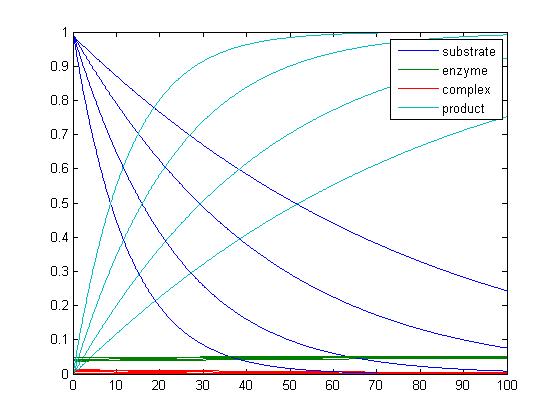
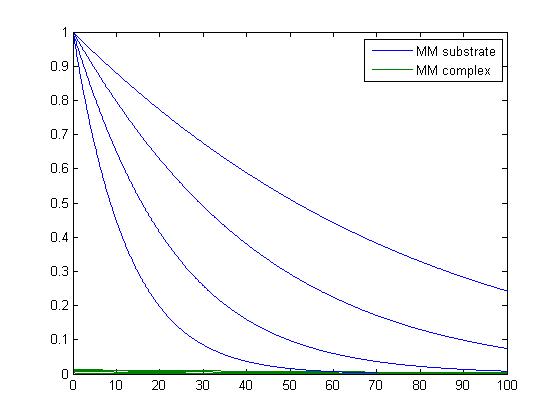
- In was not sure what was being asked when working with this code. I was not sure what program I was supposed to use. I used the michaelis_menten, catalysis and catalysis-driver. I am not sure what the differences are between catalysis and the Lineweaver-Burke program, so I stayed with the program that we worked on last week, since i do not feel that we went into depth the other program. I also do not know what the graphs are saying. I feel that I would have been able to compare them better if they were not all in the same plot. I would have been able to see which belong to which k-1 value. I know that there are settings to differentiate between the graphs, but I have not mastered those skills yet. The graphs provided below show the graphs that the catalysis driver produces.
- When k-1=0.
- When k-1=1.
- When k-1=5.
Estimating Michaelis-Menten Parameters
- After working on excel with the Lineweaver-Burke technique with the given points, I found that Vmax was 0.031551 and K was 27.10932. Vmax is found was by taking the inverse of the y-intercept on the trendline that we added on the graph. the K value was found by taking the slope of the line and dividing it by the intercept.
