20.109(F14): Mod 1 Day 6 Lipofection
Lipofection
Introduction
DNA can be put into mammalian cells in a process called transfection. If you wanted to make a mouse cell fluoresce green, you could transfect it with DNA carrying the EGFP open reading frame, a promoter directing transcription of EGFP and a signal sequence for polyadenylation of the mRNA. The promoter tells the cell that the EGFP sequence should be transcribed by RNA polymerase. The polyadenylation sequence assists in the export and stability of the mRNA so that it gets translated by the ribosome. The coding sequence tells the ribosome which amino acids should be joined together.
Mammalian cells can be transiently or stably transfected. For transient transfection, DNA is put into a cell and the transgene is expressed, but eventually the DNA is degraded and transgene expression is lost (transgene is used to describe any gene that is introduced into a cell). For stable transfection, the DNA is introduced in such a way that it is maintained indefinitely. Today you will be transiently transfecting your cultures of mouse embryonic stem cells.
There are several approaches that researchers have used to introduce DNA into a cell's nucleus. At one extreme there is ballistics. In essence, a small gun is used to shoot the DNA into the cell. This is both technically difficult and inefficient, and so we won't be using this approach! More common approaches are electroporation and lipofection. During electroporation, mammalian cells are mixed with DNA and subjected to a brief pulse of electrical current within a capacitor. The current causes the membranes (which are charged in a polar fashion) to momentarily flip around, making small holes in the cell membrane that the DNA can pass through.
The most popular chemical approach for getting DNA into cells is called lipofection. With this technique, a DNA sample is coated with a special kind of lipid that is able to fuse with mammalian cell membranes. When the coated DNA is mixed with the cells, they engulf it through endocytosis. The DNA stays in the cytoplasm of the cell until the next cell division, at which time the cell’s nuclear membrane dissolves and the DNA has a chance to enter the nucleus.
Today you will lipofect several DNA samples into your mouse embryonic stem cells. As a positive control, you will transfect one sample with a plasmid encoding full-length EGFP. This plasmid will cause any transfected cells to fluoresce green. Next time we will measure fluorescence of your positive control to assess the success rate of the transfection.
You will also be transfecting two experimental plasmids, one of which you have been constructing for weeks. The EGFP coding sequence on these plasmids is truncated at either the 5’ or 3’ end of the gene. Cells expressing these truncated EGFPs should not fluoresce green. The plasmids provide a wonderful tool for studying recombination since a cell will fluoresce green if it has been transfected with both plasmids and has recombined the genes to regenerate a full-length EGFP. Finally, you will be using the truncated EGFP plasmids to investigate the effect of double strand breaks on the frequency of recombination.
Elaborate mechanisms for coping with DNA breaks have evolved since these forms of DNA damage are so dangerous for the cell. You should (re)familiarize yourself with these mechanisms by (re)reading the excellent review by Thomas Helleday that you can find in the References section of the Module 1 frontpage. You should also check out the animations of repair mechanisms that are linked there. These animations were made by Justin Lo, a class of '08 Course 20 student and a former UROP student in Professor Engelward's laboratory.
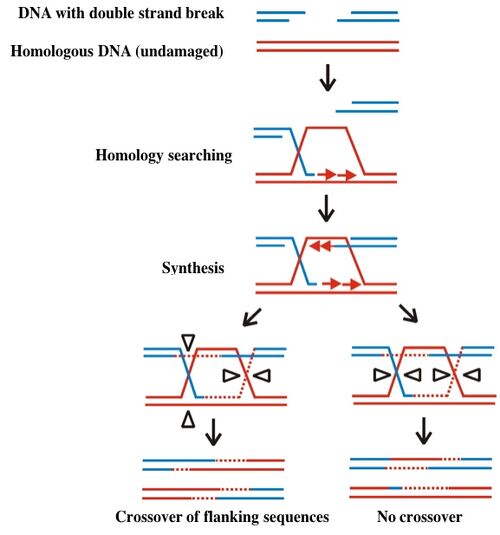
One kind of DNA damage with particularly catastrophic consequences for the cell is double stranded breaks. The broken ends of the DNA must be correctly repaired (literally here re-paired) without loss of any encoded information. The model for such repair is called to the Szostak model, named after the person who first described it. According to this model, illustrated below, a gap in one chromosome is repaired through an interaction with its homologous chromosome. The repair first requires “homology searching” and invasion of the gapped DNA (blue) into the undamaged copy (red). The undamaged DNA serves as a template for missing sequences, which are copied and then resolved as indicated by the open triangles on the figure below. Resolution can lead to exchange of sequences flanking the original double strand break, resulting in recombination of genetic information. Alternatively the integrity of the original genetic material is preserved when the repaired strands resolve without crossover.

Different, and far simpler means of repair are possible if the broken ends of the DNA can be held together, either through base pairing of the overhangs or through the chromatin structure surrounding the damage. Your investigation today will assess recombination rates for different DNA lesions and conditions for homology searching.
Protocol
While half of the class works in tissue culture, the other half will practice your statistical prowess.
Part 1: Stats Exercise
Thus far, you have been constructing a molecular sensor to quantify the ability of cells to repair double stranded DNA breaks using homologous recombination. In fact, with your truncated GFP plasmid system you only 'see' the repair of DNA through the recovery of green fluorescence. But, what if you wanted to see DNA damage instead of repair? There is an app for that -- well, not quite the app you were thinking, but there is a Matlab GUI for that -- and you'll be analyzing some data from that GUI today to practice your statistics.
One common way to quantify DNA damage employs a technique that you already completed in 20.109 -- DNA electrophoresis. Single cell gel electrophoresis, better known as the comet assay, allows us to take advantage of the fact that DNA migration during electrophoresis varies based upon its structure (think about how cut versus uncut plasmids look on a gel). Therefore, if we damage a piece (or many, many pieces) of DNA through introduction of single and double stranded breaks, we can differentiate the damaged DNA versus intact DNA using a fluorescent DNA stain. In fact, we can quantify DNA damage in a single cell!
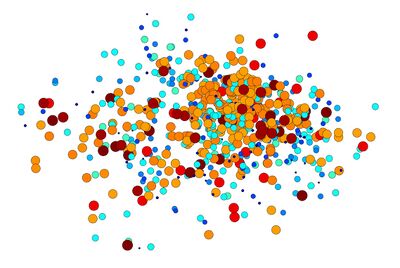
The traditional comet assay, first described in 1984, involves mixing live cells with low temperature agarose (this means it melts around 37 °C) and casting a small gel on a microscope slide. Cells were exposed to DNA damaging agents either before or after being mixed with the agarose. Following cell lysis in an alkaline (pH 9.5) buffer to unwind the DNA superstructure, the slides are placed in a gel box -- just like the ones we have in the lab -- and electrophoresed for a short time. The damaged DNA – and only the damaged DNA – will travel away from the nucleus and form a structure that looks just like a comet tail (Figure 1).
The comet assay is very sensitive and, because you measure damage in each cell individually, allows for collection of DNA damage data from many different experimental conditions. However, because the cells are mixed into the agarose, there are challenges associated with cell density (comet tails that run into each other) and difficulty with imaging (the cells might be in different z-planes of the gel). Furthermore, quantification of the main comet assay parameters, as shown in Figure 1, is tedious when performed one comet at a time and could be subject to user bias.
A collaboration between the Engelward and Bhatia labs here at MIT solved these problems with the CometChip! The CometChip is made using a microfabricated polymer mask that creates tiny microwells 50 um deep and 30 um apart in a 1% agarose gel. Once the wells are formed, cells are loaded onto the gel and 1-2 cells settle into each well. When the excess cells are removed, a consistent cell pattern remains. The cells are then exposed to a known or suspected DNA damaging agent (such as radiation) and the extent of DNA damage is quantified by calculating the percentage of damaged DNA – remember, this is the DNA in the tail of the comet – so you can simply calculate the ratio of DNA in the tail to the total amount of DNA.
Attached here is a spreadsheet that contains CometChip data from an experiment where cells were exposed to increasing amounts of radiation. Your goal is to determine if a statistically significant amount of DNA damage was induced. Think back to Agi's lecture on statistical analysis – how will you convince someone that the DNA damage was significant? You may find this spreadsheet, originally created by Prof. Bevin Engelward and modified by the 20.109 staff, helpful for this exercise. At a minimum, you should post a bar plot of the data with 95% confidence intervals and indicate if there is a statistically significant difference (i.e. provide a p-value) between conditions in your Evernote Notebook.
Part 2: Lipofection
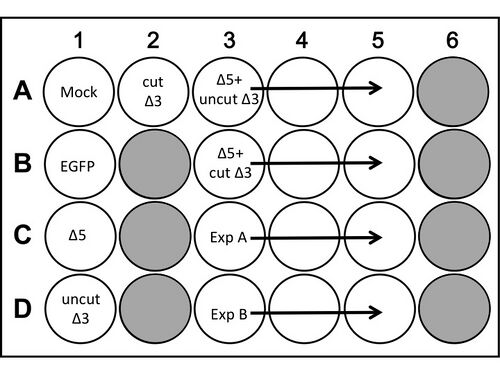
In anticipation of your lipofection experiment, one of the teaching faculty plated 1x10⁵ cells in 17 wells of a pregelatinized 24-well dish 24 hours ago. A special media formulation without antibiotics was used. Also, some of the Δ3 was cut with PmeI, a restriction enzyme that generates blunt ends and some of it was cut with BamH1. You can choose what cut site you're more interested in trying out.
A schematic for your experiment is shown below. We will discuss in class different things we might test, and we will use wells labeled 'Exp A' and 'Exp B' to test a parameter that might affect the frequency of inter-plasmid homologous recombination.

All manipulations are to be done with sterile technique in the TC facility.
Timing is important for this experiment, so calculate all dilutions and be sure of all manipulations before you begin.
For each lipofection you will need
DNA:	 	0.1 μg (of cut or uncut Δ3) and/or 0.1 μg (of Δ5) in 50 ul OptiMEM
Carrier: 	2.5 μL Lipofectamine 2000 in 50 μL OptiMEM
- 1. Dilute enough carrier for 17.5 lipofections (the excess will ensure that you have enough due to pipette errors). Let the dilution sit in the hood undisturbed for at least 5 minutes but not more than 30.
- 2. For the lipofections to be done just once, you’ll need 50 ul of DNA in OptiMEM. Use the table below to help you calculate the appropriate volumes to use in your experiment.
| Tube | [DNA] stock | DNA/lipofection | Volume DNA | Volume OptiMEM |
|---|---|---|---|---|
| mock | NA | NA | NA | 50ul |
| EGFP | 0.05 ug/ul | 0.1 ug | ||
| Δ5 | 0.05 ug/ul | 0.1 ug | ||
| uncut Δ3 | 0.05 ug/ul | 0.1 ug | ||
| cut Δ3 | 0.05 ug/ul | 0.1 ug |
- 3. For the lipofections to be done in triplicate, you’ll need a total of 150 ul of DNA diluted in OptiMEM. By making one lipofection cocktail that is later divided between replicates, you can be confident that each replicate was treated identically. The basic protocol is to do each lipofection with 0.1 ug of ∆5 and an equal, greater, or lesser amount of cut ∆3.
| Tube | [DNA] stock | DNA/lipofection | Volume DNA | Volume OptiMEM |
|---|---|---|---|---|
| Δ5/cut Δ3 | 0.05 ug/ul for Δ5 0.05 ug/ul for cut Δ3 |
0.1 ug of Δ5 and a variable # ug of cut Δ3 |
- 4. You should now have at least 7 eppendorf tubes, five with 50 ul of OptiMEM +/- DNA and four with mixtures of Δ5 and uncut/cut Δ3 DNA in a volume of 150 ul. Add an equal volume of diluted lipofectamine to each eppendorf (i.e., 50 ul if the tube has 50 ul). Pipet up and down to mix.
- 5. Incubate the DNA and lipofectamine cocktails at room temperature for 20 minutes. To allow the DNA/carrier complexes to form, it is important that you do not disturb the tubes during this incubation. During this time, aspirate the media from the cells in your 24-well dish, wash the wells with 0.5 ml PBS, then put 0.5 ml of fresh media on the cells. The PBS and media can be aliquoted with a 5 ml pipet.
- 6. After the 20 minute incubation is over, use your P200 to add 95 ul of the appropriate DNA:lipofectamine complexes to each well. Since the carrier is quite toxic to the cells it’s a good idea to gently rock the plate back and forth after each addition.
- 7. Return the plate to the 37°C incubator.
- 8. Tomorrow, one of the teaching faculty will remove the lipofection media from your cells and will replace it with 1 ml of fresh media. Approximately 48 hours after performing the lipofection, you and your partner will collect the cells and analyze their fluorescence by FACS.
DONE!
BEFORE NEXT TIME
Sign up for time at the FACS here. Groups will have to stagger their arrival at lab in order to keep the number of groups and samples at the FACS facility manageable.
Navigation Links
Next Day: Mod 1 Day 7: Data analysis Previous Day: Mod 1 Day 5: Examine candidate clones and Tissue Culture
