|
Objective
- To complete the procedure outlined by Dr.Matt Hartings here<br.>
- Using a bradford assay and hemoglobin as our protein of interest we made 6 standard solutions and analyzed via UV-Vis to make a calibration curve.<br.>
Procedure
- The procedure the was followed as dictated by Dr.Hartings. The specific solutions were made as described below.
- The first table represents how the master solution was made.
 <br.> <br.>
- The next table represents how each subsequent standard solution was made.
 <br.> <br.>
- Please Note all of the solutions were prepared using a 2-microliter pipette, and a 1000-microliter pipette.
- The blanks were prepared using 800 micro-liters of buffer and 200 micro-liters of the bio-rad.
Data
- The graphs depicted below are the individual absorbance spectra for the hemoglobin standards. The set of standards were made twice and run via UV-Vis to get an more accurate calibration curve. Please note that the second set of samples had to be run twice because one of the blanks was made incorrectly and the resulting graphs weren't similar. Using the same blank as the first set, the second set of standards were run and the results were more representative of the first set, and their spectra are shown below.<br.>
 <br.> <br.>
- Based off of these spectra the absorbance at the peaks were taken and data is shown below.<br.>
 <br.> <br.>
- The graph below represents the max absorbances for each spectra together in a calibration curve.
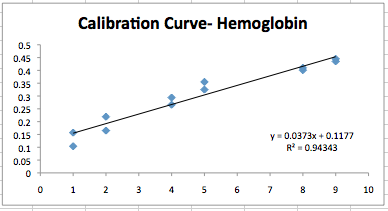 <br.> <br.>
- Now we can use this calibration curve for future experiments involving hemoglobin.
|
 Biomaterials Design Lab


