|
Objective
To finish the procedure and lab presented on Sept 3, 2013. here.<br.>
- For Both the Adenosine Data and the Inosine Data,<br.>
- Perform a Grubbs Test to eliminate outliers. Data analysis was acomplished using the following resource [1]<br.>
- After eliminating the outliers determine the concentration of an unknown sample.<br.>
- Find the molar absorptivity of adenosine and inosine using the class calibration curves.<br.>
Procedure
Concentrations that are contained in the inosine graph below are presented in yesterdays lab write up, here.<br.>
- Note that we no longer performed a q-test and confidence intervals. In it's place we performed a Grubbs test.
Data
Group Inosine Data Analysis
- The graph below is our groups individual absorbance spectra for inosine.<br.>
 <br.> <br.>
- Note that the concentration (1.6*10^-5M) had to be run twice. After running this concentration the first time it was noticeably different than the other samples on the calibration curve by appearing incredibly close to the point at 2.4*10^-5M. As a result, it was made again, and the second time it fit in better with the other data presented on the graph by making it appear more linear. It is suspected that concentration of (2.4*10^-5M) was made twice the first go around.
- Peak at 249nm<br.>
- The graph below is our groups individual calibration curve using the the absorbances at the peak 249nm.
 <br.> <br.>
Pooled Class Data
- The graphs depicted below represents the pooled class data depicted in a calibration curve for adenosine and inosine.
 <br.> <br.>
Grubbs Test Analysis
- Using the data points from the class calibration curves, the table below shows the mean and standard deviations for each concentration in the class data for adenosine and inosine. This data was used in the Grubbs test.<br.>

- After performing a Grubbs test it was determined that four data points from the adenosine graph are considered outliers using 95% confidence.<br.>
- The outliers for concentrations 3E-5, 2.5E-5, 2E-5, and 1.5E-5, were the absorbances .558, .442, .406, and .304 AU respectively.<br.>
- Note these outliers were found using means calculated from each cluster of x-values, not from the best fit line.<br.>
- The points that were outliers had a grubs value greater than 1.67 because data points were in groups of five.<br.>
- Please note that their were no outliers in the inosine data. This was deduced because no data point had a grubbs value greater than 1.46 becasue data points were in groups of four. <br.>
- The graph below depicts the calibration curves of the class excluding the outliers.

- Please note that in both sets of data their were two concentrations that only had one or two data points. Due to the low number of data points for these concentrations is is impossible to perform an effective Grubbs test.<br.>
Unknown Sample Analysis
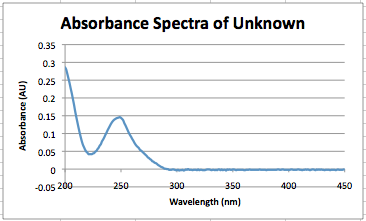
- The graph depicted below is the absorbance spectra of an unknown sample of inosine received from another group in class.(Zack, Moira, and Eleni)<br.>
 <br.> <br.>
- The peak corresponds to 249 nm and has an absorbance of .146AU.<br.>
- Using the class calibration curve for inosine and the absorbance of the unknown, the calculated concentration is, 1.32*10^-5 M.
- After asking; the concentration was supposed to be 1.2*10^-5 M for the unknown. Using percent error analysis this means that their was 10% error, using the calibration curve.
Matt Hartings What is the error on this calculation?
Calculation of Molar Absorptivity
- Based on the class calibration curves the molar absorptivity of Adenosine and Inosine were calculated using the slope of the calibration curve. As a result, the calculated molar absoptivities are as follows, <br.>
- Adenosine; 13146 L/(mol*cm) at 259nm
- Inosine; 11007 L/(mol*cm) at 249nm
|
 Biomaterials Design Lab


