MacCurveFit
Recent members• Alex Holcombe
|
Projects• Testing Booth Calendar |
|
Technical• Skills Checklist |
Other• Plots,Graphs
|
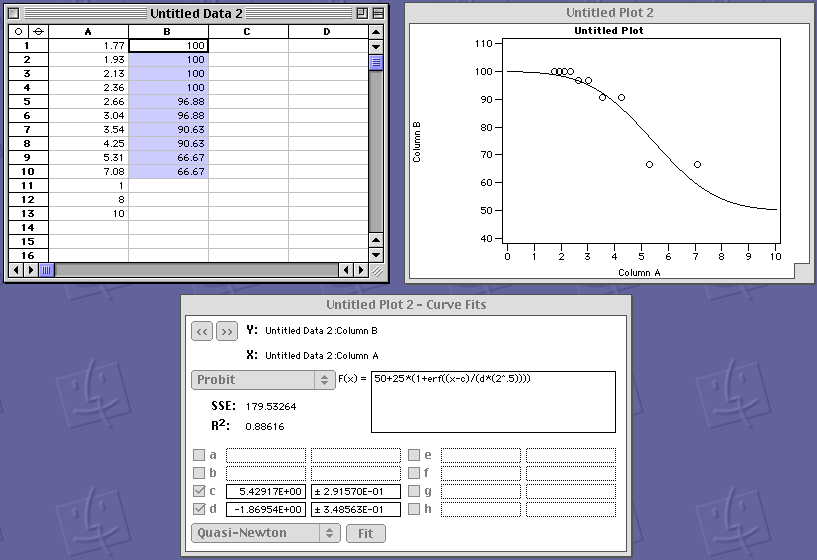
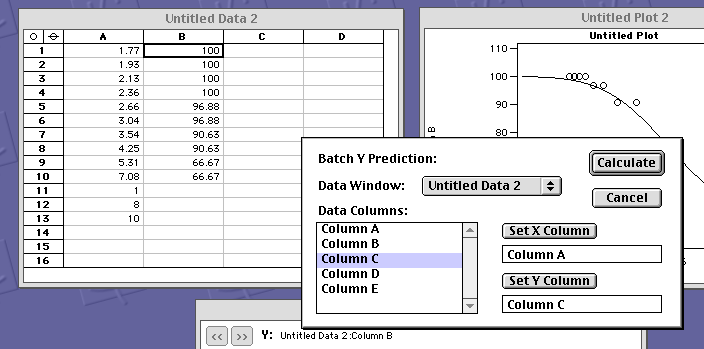
OK, here are two screen captures for MacCurveFit.
In the first I have the Hz in column A and the % correct in B. I have added a few Hz values in A for getting a predicted fitting curve after the fit is fit.
The function is Probit but I have fixed the min and max values at 50 (chance) and 100 (perfect, 25 x the erf function which tops out at 2). I put a value around the expected threshold in "c" and I put a negative number, -1, in "d" to help get a fit on first try. Once I get the fit, the "c" value is the 75% threshold and its parameter SE is the SE of the threshold estimate. The "d" value is the slope or something like that.
Once the fit is in, I batch predict y values for the x (Hz values) that I can export to Excel to make a predicted curve for the graph (you could do the formula if you want). Here is an example with sparse x values. I usually put in a lot of x values to get a smooth curve. The predicted % correct go in column C in this example.
Patrick Cavanagh Laboratoire Psychologie de la Perception Université Paris Descartes

