Biomod/2017/StJohns:Planned Experiments
Planned Experiments
Stop the Degradation of VLP w/ Cryo-protectant
This summer, we mainly dealt with troubleshooting problems that arose. The first of such that plagued this project was the stability of the MS2-T21 VLPs that we use. To properly test the binding capabilities of our DNA origami, we need to be sure that both components, the DNA origami and the VLP, are structurally sound.
DNA triangles were used as a control for the claw as they have been shown to bind to VLPs.4 At some point in the project, our control experiment produced irregular results. The band shift signifying the binding event between the triangle and the VLP was not as distinct now. After dozens of gels with the same irregular results, we postulated that our VLPs degraded during its time stored at 4 °C.
To confirm the degradation of the MS2 VLPs, our collaborators sent a fresh batch for our use. For long term storage, they suggested we add trehalose to the VLP solutions as a cryo-protectant, which would allow us to freeze our VLP’s at -20 °C.
As seen in Figure 23, there is a distinct difference in behavior of the old and the fresh VLPs when binding to triangles. There is a clearer gel shift in the triangle band, representing binding to VLP, a gain in molecular weight. There is also a slight difference in the VLP band in reference to the DNA ladder. To make sure that the long-term storage procedure for the VLPs (and the required steps to remove trehalose) did not adversely affect their integrity, we bound them to triangle in conjunction with the VLP degradation check. No difference in behavior between the fresh and the week-long frozen VLPs was seen.
These results confirmed the degradation of our previous set of VLPs and confirmed that long-term storage of VLPs was possible with cryo-protectant.
Improving Formation of DNA claw
With MS2 VLP degradation no longer an issue, the next item in question is improving the quality of our claws. Our D.O. claws have never really given us a nice band on a gel; claw bands were always rather fat. We figured it was something we had to put up with. Unfortunately, analyzing binding experiments using claws proved to be difficult as we cannot say confidently that a band shift is actually a shift when the band in question is fat and moves slightly.
Inspired by what other groups have done that provided them with tight bands for complex D.O. systems, we decided to delete from the end structure the staple strands closest to the center of the DNA claw.7 By leaving these staples out, the now ‘unhinged claw’ should have loops of single-stranded plasmid pointed towards the center.
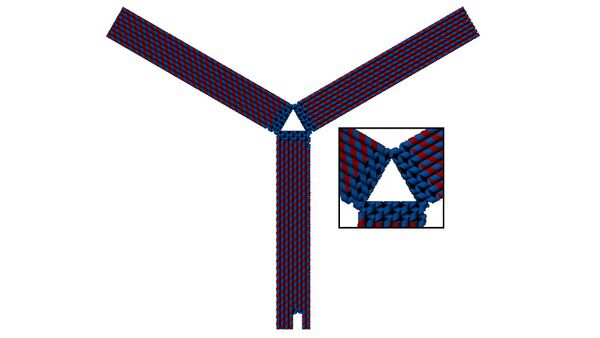
These loops of single-stranded DNA should act as a barrier to base stacking seen in DNA (that relies on the hydrophobic effect). Without these loops, base stacking occurs across two arms of the claw on their centermost sides, warping the claw into the ‘T’ shape often seen in AFM images of our claw. With the loops, base stacking is less likely to occur, leaving the claw in its ideal evenly open triangular prism configuration.
Comparing these ‘unhinged claws’ to the previous version of claw that includes all staples, one can see a clear improvement on band shape, as seen in Figure 24. A now tighter band for claw will allow for more confident analyses to be made regarding binding.
Binding with ‘Unhinged Claw’
The logical next step in the project was to try binding with the ‘unhinged claw’ design. As seen in Figure 25, there is a noticeable change from the unbound claw to the VLP-bound claw, going from tight to much fatter/smeary. Without further imaging (such as AFM and TEM, which is something we are looking at in the near future), it cannot be concluded that it is with a binding event that has our preferred binding geometry. However, the drastic change in band shape indicates that some kind of interaction has taken place between the unhinged claws and the VLPs.
FRET Studies
The design of claw for FRET studies required several of the original staple strands to be removed in order to insert one donor and two acceptor sites for FRET (Fluorescence Resonance Electron Transfer) analysis. These sites were placed close to the hinged portion of the claw, allowing them to be close enough to visualize an energy transfer upon the closing of the claw. By incorporating these donor and acceptor dyes, we can investigate how the claw binds onto VLP, and whether it closes up on them as expected. Unfortunately, results for binding experiments using FRET-ready claws have been rather anomalous. Even unbound claw gave a FRET signal (Figure 26).

With not much success with FRET experiments, we decided to move the dyes around to get them closer together, which would increase the chance for FRET for a bound claw. The dyes as they were in the original design may not be in the best orientation. The most cost effective method in the repositioning of the FRET dyes available to us at the time was to modify the fluor-staple strands ourselves. We did this via click chemistry with oligo-alkynes and dye-azides followed by purification.
This is still ongoing work to get a FRET signal on VLP-bound claws, with the original and/or click-synthesized FRET dyes.
Fluorescence Polarization
In conjunction with our binding experiments using MS2 VLPs, we intend to bind NoV VLPs to aptamers. To analyze this binding, we want to use fluorescence polarization, a technique in which changes in molecular mobility, and as such molecular weight, between aptamer in bound and unbound states can be detected. Fluorescence polarization is determined from intensity of fluorescence parallel and perpendicular to the plane of linearly polarized excitation light. This can be expressed as either polarization or anisotropy, differing in orders of magnitude where [p] is polarization and [r] is anisotropy.
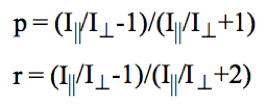
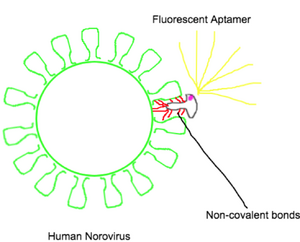
For our experiments, we focused on polarization values. We used a known fluorescent aptamer (AG3, approximately 50 Kilo Daltons) as our stable baseline polarization values, to then compare to the polarization values given when bound with a NoV VLP (several Mega Daltons in weight, significantly larger than the aptamer). The human norovirus was chosen due to the clinical relevance it holds, which we received from a collaborator. This work would be done before incorporating the fluorescent aptamer to the current claw design.
Polarization with Standard Dyes
Our first approach to fluorescence polarization was to demonstrate successful repetition of polarization values using standard dyes according to the literature.8 The repetition of fluorescence polarization was done over a range of amount of the dyes used (0.8 fmol to 8 nmol). The use of these standards would ensure the accuracy of our measurements, as well as the calibration of the fluorometer.
Comparing the values obtained from those in the literature, we were satisfied with our abilities in both accuracy and precision (see Figure 35 for Phloxine B, one of the four dyes used). One discrepancy which we had early on in our polarization measurements was the confusion between anisotropy and polarization values; as explained previously, there is a difference in magnitude. Thus, our first measurements using the standard dyes were lower than the literature values due to their measurement as anisotropy, rather than polarization.
Evaluating Stability of Fluorescent Aptamer
We want to be able to translate our ability to take precise polarization measurements, using a fluorescently tagged aptamer, AG3, instead. Thus, as was previously done, we need to demonstrate a repetition of polarization values over a range of concentrations. This will function as one of two controls implemented to compare to the binding event using the NoV VLP. A secondary control we will use is a fluorescently-labelled repeated T-nucleobase sequence DNA strand (T21), which we reason should not bind to the VLP due to poly T’s well-known lack of structure. Some conditions we took into consideration when performing these experiments include temperature, solvent viscosity, and fluorescence lifetime, all of which fluorescence polarization is known to be sensitive to.
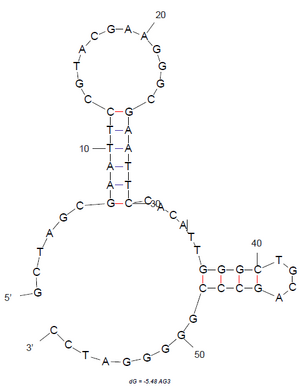
The AG3 aptamer we are using has the sequence GCTAGCGAATTCCGTACGAAGGGCGAATTCCACATTGGGCTGCAGCCCGGGGGATCC. Last summer, we tried to no avail to get aptamer sequences from Jaykus' group for binding, but moved to that sequence. As seen in Figure 17a, the M-fold suggests that this is a low energy conformation of the aptamer.
The fluorescent aptamer (Figure 36) shows no significant fluctuations in its polarization measurements, over a range of concentrations, thus satisfying the precision of our measurements. There is a slight fluctuation in polarization as with increasing concentration of the fluorescent aptamer. A hypothesis we have to account for this is the possibility of self-absorption, and thus, re-emission.
Binding of NoV VLP
After satisfying our ability to reproduce our control variable values, we confronted demonstrating a change in polarization when binding the NoV VLP to the fluorescent aptamer. According to the literature, we expected a 500% increase in polarization when bound, as opposed to unbound.9
In our binding titration curve (see Figure 37), addition of T21 to the NoV control kept a constant polarization value, apart from some of the higher concentration readings, confirming that the T21 was not interacting with the NoV VLP. The aptamer titration gives us the classic S-shaped curve, clearly indicating a binding interaction between aptamer and NoV VLP. However, after significant effort, we have not been able to reproduce these polarization measurements, leading us to revisit aptamer literature. This may lead us to employing the use of new fluorescent aptamers.
Signal-Off Electroactive Dyes
An essential pillar to our VLP binding claw is detecting the binding event and quantifying it. We plan on using a “signal off” method to do so, where a constant signal is detected when the electroactive dye is near an electrical surface. As seen in Figure 6, a binding event causes a conformational change in the species, moving the electrochemical dyes away from the surface disrupting the signal that can be detected. In other words the signal being turned off or decreasing gives us a measurable piece of data saying that binding has occurred.
Purity Check and Quantifying Methylene Blue Strands
Our first approach to determine if our MB strands were suitable for use was checking the purity of the strands. We hoped to have tight bands showing little impurities present when running a denaturing gel. We chose two different sequences with MB attached, T21 and (TCA)7, to give us more options when testing for attachment to our D.O. structures. Two different sequences of DNA allows us to make the VLP binding one sequence, T21 with A21 for example, and MB binding another sequence, (TCA)7 with (TGA)7.
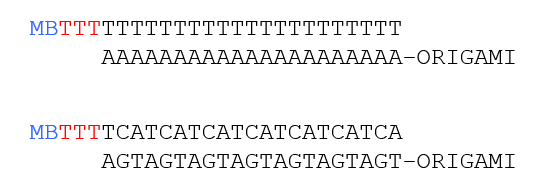
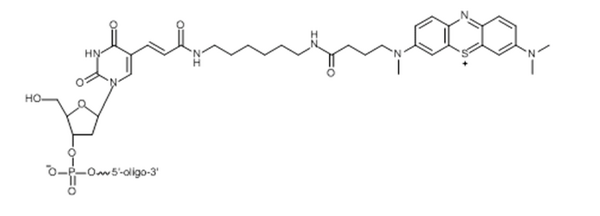
In addition to making sure the MB strands were pure, we intended to detect a decrease in intensity as the concentration of MB decreased. This is very important to our overall project because detection is based on the quantification of MB. If a noticeable difference is detected between intensities by decreasing concentration it becomes a proof of concept for later work.
From our purity check, we were able to get very clean bands for both T21 and (TCA)7 as seen in Figure 30. There is also a clear drop in intensity when going from 5 pmol to 0.5 pmol of MB. This is also seen when dropping to 0.05 pmol of MB, which still displayed slight fluorescence as opposed to the controls without MB bound.
It should be noted that the bottom-most band that is consistent through the entire gel was due to the denaturing loading dye.
Synthesizing and Quantifying Up-Triangle with Methylene Blue
With now essentially pure MB strands, we planned on attaching MB to our D.O. triangles. The ‘Up’ conformation of sticky strands was our most tested orientation and was used to bind Triangle to VLP previously, making it a suitable candidate to test MB attachment. Forming proper origami wasn’t the only goal. We want to quantify the number of MB present on each Triangle as well.
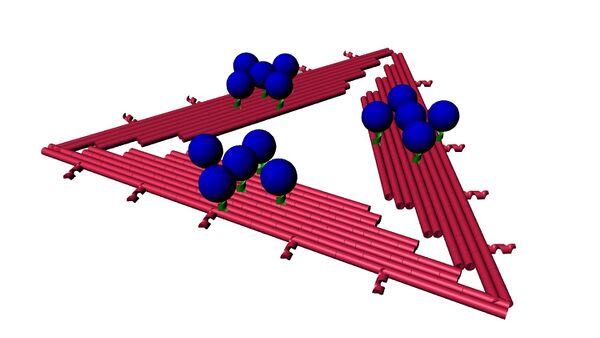
For this experiment we used triangle that had the standard 15 binding sites, 5 on each side, and designed a triangle with 7 binding sites. The 7 sticky strands were distributed as two, two and three strands for the sides of the triangle. The purpose of using these different designs is to replicate a difference in signal intensity but by keeping the origami number constant. Just like decreasing the amount of the MB strands by themselves, a decrease in the number of MB attached to origami should also produce a visible difference in intensity.
This experiment would also confirm that complement strands (T21 with A21) should bind and non complementary strands ( T21 with (TGA)7 ) shouldn’t. It also ensures that there are no molecular interactions between MB and DNA in general, which may cause unwanted binding. This was done by annealing and running each type of MB strands, T21 and (TCA)7, with all four types of triangle: Up-Triangle(15) A21, Up-Triangle(7) A21, Up Triangle(15) (TGA)7 and Up-Triangle(7) (TGA)7.
As seen in Figure 32, we were successful on all fronts. After staining the 1% agarose gel in SYBR then imaging it we were able to see a clear band representing origami formation through all lanes (2-11). The controls, lanes 2 and 3, were used as a reference band because they were blunt triangle without any sticky sites. In comparison to these control bands, some lanes experienced a slight upward shift in their bands alluding to a heavier origami, or origami that experienced binding, specifically lane 4, 7, 8, and 11, which were expected to bind MB according to their complementary strands.
This was confirmed by looking at the prestained image using a scan to image the fluorescence of MB, Figure 31, which only showed fluorescent bands present at the 4 lanes (4, 7, 8, and 11). The other bands lanes showed no MB at the band level, instead showing the MB running on its own at the bottom portion of the gel. In addition to that, the 15 MB per triangle bands (lanes 4 and 7) showed a much higher intensity in comparison to the 7 MB per triangle bands (lanes 8 and 11). It can be noticed that the band for 15 MB triangle is higher up on the gel than 7 MB triangle, due to having an increased molecular weight from the extra attached MB.
Modifying to Side-Triangle to Allow For Both MB Attachment and VLP Binding
Now that we can quantify MB on triangle, its orientation becomes important. In the conformation with MB pointing upward, our big picture signal-off mechanism is invalid. There will also be no attachment point for the VLP. To form a signal, MB must be in close proximity to the gold surface where the origami is attached; so a logical position would be on the edge of the origami, i.e. the side. A side orientation will have the MB closest to the gold surface when no binding is occurring giving off a constant signal. But once there is a binding event the claw or triangle will physically change shape to bind with the VLP, moving the three sides in an upward direction away from the gold surface. This movement will lift the MBs attached to the side away from the surface, which will disrupt the signal due to their distance from the gold surface.
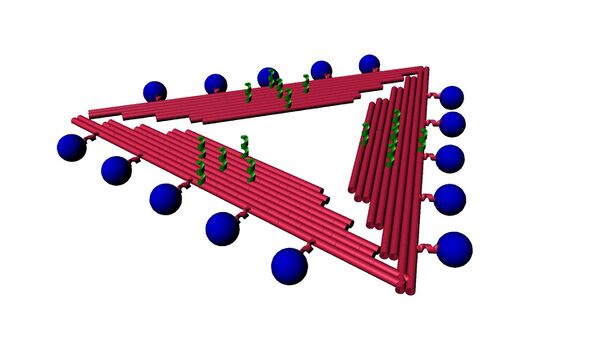
Designing the Side-Triangle’s sticky strands was done using Cadnano. After selecting an even spacing of possible sticky strand points we changed the two blunt staple strands that were involved in making the new sticky strand. Choosing the correct spacing to ensure the sticky strand left the origami at a parallel level involved using knowledge of DNA’s angle turn per base while keeping in mind that a staple strand must not be too short near a crossover point. Our new side sticky strands were designed to be A21 and (TGA)7.
These results were similar to those of Up-Triangle with MB attached, as seen in Figures 33 and 34. Only the MB-bound triangles were fluorescent before staining, and a slight shift upwards of the MB-bound species indicated that MB had attached to the side sticky sites.
We are currently working on attaching thiols to these MB displaying origami and characterizing these systems using gels and AFM, as thiols would allow for coupling to a gold surface.
Improving Robustness of DNA Origami
If our origami was subjected to denaturing conditions such as high temperatures, the exposed DNA strands will denature and fall apart. To prevent this from happening, we wanted to use a crosslinker to interlock the DNA strands. We want a more robust system as we may have to wash our sensors with slightly denaturing buffers or solutions.
We decided to work with 8-MOP as a crosslinker, considering the work done by others to increase the thermal stability of their origami.10 When UV light makes contact with the 8-MOP and the thymine bases, a permanent covalent reaction occurs between them, resulting in the 8-MOP molecules acting as bridges between DNA strands that interlock them in place.
One thing we want to make sure of is that our D.O. structures are still functional in denaturing conditions after 8-MOP treatment. This includes making sure we get a high return of crosslinked triangle and that the sticky sites on our triangle can still bind. We chose poly-dA sticky sites on our triangle because they are 100% purines. 8-MOP reacts almost exclusively with pyrimidines (dC and dT) - thus we hypothesized that 8-MOP would not interferwe with their binding ability.
We subjected our 8-MOP crosslinked triangles to denaturing conditions in a denaturing acrylamide gel to test for success and yield of crosslinking, which can be seen in Figure 27. One variable we played around with to increase the return of crosslinked triangles was the time allowed for the photo-reaction to take place. Comparing crosslinked triangles of varying reaction times, it was seen that increasing reaction time increased the crosslink yield, as illustrated in Figure 28.
To ensure that the sticky sites on the D.O triangles are still functional, we bound them to fluorescently tagged T21 strands. We expect the triangles to be fluorescent after the fluorescent T21 strands have attached themselves to the sticky A21 sites on the triangle.
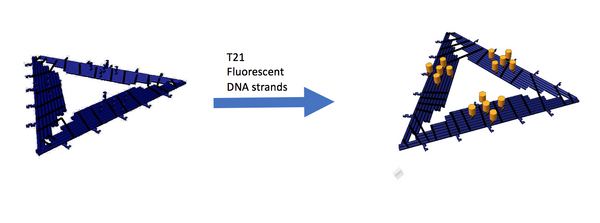
As seen in Figure 29, there is a difference in gel mobility between crosslinked triangles and crosslinked triangles bound to T21. The bound triangles are shifted upwards slightly, a sign that it has gotten heavier due to binding to the T21 strands.
Techniques
- Atomic Force Microscopy (AFM)
- Gel Electrophoresis
- Fluorescent Resonance Electron Transfer
- Fluorescence Polarization/Anisotropy
