BME100 s2017:Group8 W8AM L6
| Home People Lab Write-Up 1 | Lab Write-Up 2 | Lab Write-Up 3 Lab Write-Up 4 | Lab Write-Up 5 | Lab Write-Up 6 Course Logistics For Instructors Photos Wiki Editing Help | |||||||
OUR COMPANY
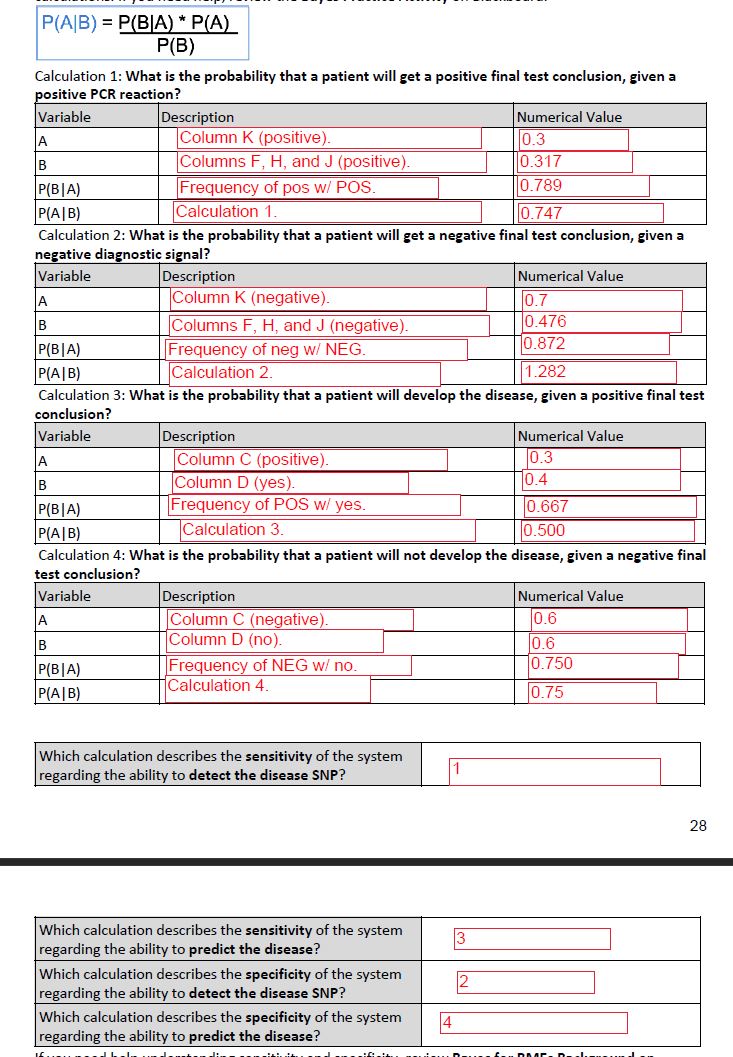
Easy-Peasy PCR Kit LAB 6 WRITE-UPBayesian StatisticsOverview of the Original Diagnosis System To test patients for the disease-associated SNP, 8 groups of 6 people and 2 groups of 5 people--for a total of 58 people--diagnosed two patients per group. For each of the 20 patients, the groups had three replicates of their two patient’s DNA, along with a positive and negative control. Having more than one copy of the patient’s DNA allows a group to perform multiple trials on the DNA sample and reduces the opportunity for error. The positive and negative controls also allow the group to check their samples against a controlled value. Before testing their patient’s DNA samples, each group performed the fluorimeter procedure and ImageJ analysis with Calf Thymus DNA. This safeguard allows each group to figure out how to use the fluorimeter and ImageJ before testing their patient’s DNA. While analyzing images within ImageJ, the settings were set to integrated density, mean grey value, and split channels. Split channels allows the image to be split into red, green, and blue concentrations. This allows ImageJ to focus on the SYBR Green concentration within the fluorimeter and receive the most accurate calculations of PCR within each drop. Specifying the settings on ImageJ and analyzing multiple images for each trial of patient DNA reduces the amount of variation and error in each group’s calculation. After each group completed analyzing their fluorimeter photos in ImageJ, they submitted their results through a Google Doc, which was then compiled onto an Excel spreadsheet. Two groups got inconclusive results for one of their patients. A possible source of error that could’ve led to some problems with calculations is mixing up the photos once a group began to analyze them in ImageJ. If a group mixed up the positive and negative control images, that would screw up all of their calculations and results. What Bayes Statistics Imply about This Diagnostic Approach For the first calculation, the Bayes value was between 50% and 100%. This indicates that although the results are not completely reliable, they can still be depended upon to a certain degree. More tests would need to be performed to come to a conclusion as to whether or not the patient actually has the disease SNP. For the second calculation, the Bayes value was close to 1.00. This indicates that the results are highly reliable and that it is very likely the patient has the disease SNP. For the third calculation, the Bayes value was about 50%. This indicates that the results were not reliable and further tests should be done to ensure a proper diagnosis and deduce whether or not the patient has a high or low probability of developing the disease. For the fourth calculation, the Bayes value was between 50% and 100%. Once again, this indicates that although the results are not completely reliable, they can still be depended upon to a certain degree. More tests would need to be performed to ensure a proper diagnosis of the patient and determine the likelihood of the patient to develop the disease. A possible source of error that may have occurred during the lab was the quality of the images that were taken. The distance between the smartphone used to take the images and the lightbox was not entirely consistent throughout the lab. Another source of error that could have affected the data was due to the fact that the smartphone used to take the images had to be switched out for another halfway through the lab due to technical issues. This would have affected the image quality even more. A final source of error that could have occurred during lab and therefore affected the data and following calculations was due to technical issues on on ImageJ. Because new and individual ovals/circles were drawn for each time, the data would not have been as consistent as it would have been had each oval/circle been completely uniform and equal to each other.
Intro to Computer-Aided Design3D Modeling Our Design
Feature 1: ConsumablesIn our Easy-Peasy PCR Kit, the consumables will be very similar to the consumables in the PCR kit we used in lab. Our kit will include the same PCR mix and primer as our group had no problem using it and it will be easy to use in a classroom environment. Our kit will store the SYBR Green solution in a special vial that does not allow UV rays through. Since the SYBR Green is sensible to light, storing it in a special vial will allow it to last longer and react the way it's supposed to with the PCR mix and the fluorimeter. Unlike the various PCR kits we've used here on campus in this class and others, all of our PCR kits will have the same type of micropipettor in them. While the technology is all the same, some micropipettors are more sensitive than others. To transfer the desired liquid from the micropipettor to the vial, the user pushes the button down to the first click and then down to the second click to dispose of the plastic tip. The micropipettor our group used in lab wasn't very sensitive and we could not tell when we had gotten to the first click or not. In our Easy-Peasy PCR Kit, the micropipettors will have very clear first and second clicks so students in a high-school classroom environment can easily use the tool. Feature 2: Hardware - PCR Machine & FluorimeterIn our Easy-Peasy PCR Kit, the OpenPCR machine will remain the same as the one we used in lab. After interacting with the machine and doing some research on it, the OpenPCR Machine is extremely user-friendly and cost-friendly. The OpenPCR machine costs around $600 and comes deconstructed, like IKEA furniture. Having the user construct the machine themselves while following an easy-to-use manual keeps costs low and also teaches the user how each part works together in the PCR duplicating process. The fluorimeter in our Easy-Peasy PCR Kit will look different than the one we used in lab--but will work just the same. Our fluorimeter will contain an adjustable phone stand attached to the actual fluorimeter. The biggest problem with the fluorimeter we used in lab came when it was time to take the pictures of the drops. Although the fluroimeter in lab came with a phone stand, it didn't support the phone and it was hard to keep the distance between the phone and fluorimeter constant for all of the trials and pictures. Our fluorimeter's phone stand will be attached to the fluorimeter itself, so there won't be a problem with keeping the distance consistent throughout the trials. Both the phone stand and the distance will be adjustable. This way, users can tighten the phone stand to fully hold and support their phones and they can adjust the distance accurately, depending on the requirements of the lab.
| |||||||


