BME100 s2017:Group7 W8AM L6
| Home People Lab Write-Up 1 | Lab Write-Up 2 | Lab Write-Up 3 Lab Write-Up 4 | Lab Write-Up 5 | Lab Write-Up 6 Course Logistics For Instructors Photos Wiki Editing Help | |||||||||||||||||||||||||||||||||||||||||||||||||||||||||||||||||||
OUR COMPANY
Our Brand Name LAB 6 WRITE-UPCALCULATION 1: Probability that the sample actually has the cancer DNA sequence, given a positive diagnostic signal:
CALCULATION 2: Probability that the sample contains a non-cancer DNA sequence, given a negative diagnostic signal:
CALCULATION 3: Probability that the patient will develop cancer, given a cancer DNA sequence:
CALCULATION 4: Probability that the patient will not develop cancer, given a non-cancer DNA sequence:
Bayesian StatisticsOverview of the Original Diagnosis System During class there was an assessment to test a disease associated SNP by testing 34 patients in the BME 100 lab. By having a total of seventeen teams within the course, a total of 34 patient DNA profiles were tested for the disease. Many factors were taken into account concerning keeping error low. For example, three different trials were performed for each patient, and the average of the results were taken for each patient in order to decrease the variance. Also, positive and negative controls were used to compare the patient results to certain positive and negative data, which allowed the use of ImageJ to analytically determine the likeness of each patient trial to the controls. This eliminated the error that would have occurred by judging and comparing the images using the human eye. The calibration setting involved in each ImageJ analysis also kept error down by taking measurements of the same numeric area of pixels for the respective trials for each patient. In other words, Trial 1 for patient 1 analyzed the same area of pixels that was analyzed for Trial 1 of Patient 2. The classes final data was all compiled to show the different patients and their final results of positive or negative. This total data allowed for the analysis of Bayes statistics to further understand the data that was collected.
In Calculation Three, the results of the Bayes value was close to 1.00. This implies a highly reliable probability of PCR that the patient will develop cancer, given a cancer DNA sequence. Because of these high results, a company could rely on the data; however, they would need to be slightly wary since the results were not exactly 1.00. In Calculation Four, the Bayes value results were between 50% and 100%. This implies a less than high probability of PCR that the patient will not develop cancer, given a non-cancer DNA sequence. Although these values are above 50%, they are still not high enough that a company would feel sufficiently comfortable relying on these results. More than likely, the company would need to do additional testing.
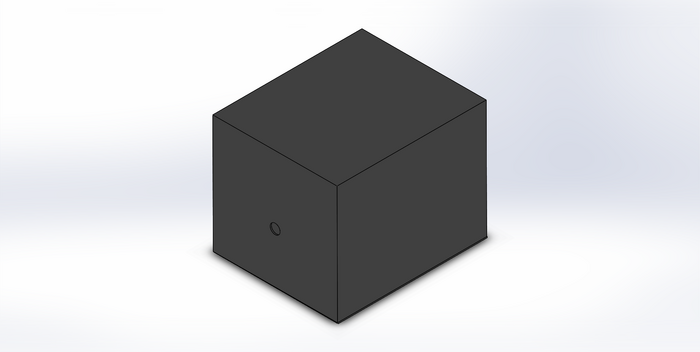
During the lab, one of the possible sources of error included image quality. The images may not have been optimal quality because the device that was used to take them did not meet all of the recommended specifications. Another possible source of error included the human error was involved with manually drawing the ovals on ImageJ. Since new ovals were drawn every time, there is a possibility that the ovals were inconsistent with the actual mean. The final source of error, and perhaps the most significant as well, was the fact that every time a trial was run, the entire PCR device moved as well. The cover was continuously removed and put back between trials, so the location frequently changed. This could have caused significant changes in the way that the data was collected. Intro to Computer-Aided Design3D Modeling The software our team used during the Computer-Aided Design lab is Solidworks. Solidworks is a modeling CAD and CAE program that works on Microsoft Windows. The team did not face difficulties using Solidworks because of the past experience many of the group members had prior to taking this class. While using Solidworks, the team was focusing on the fluorimeter box and it was easy to design. Overall, designing and assembling the parts together was simple. Our Design
 
The design has a brace that is connected to the box. This brace works to give a platform for the fluorometer to stay secured between every run and trail. The next improvement has two parts a camera hole and a phone brace The changes made to the current design focused on eliminating any randomness caused by a user in everyday use. This design is different because it tackles and focuses on a current aspect that the current OpenPCR design fails to address - consistency. The current design gives inconsistent spacing between the camera and the fluorimeter after every use or the pictures obtained were sub-par because the current method is awkward - leading to there being pictures that are unusable. Currently, there is no way to ensure that the fluorometer stays in the same place consistently or a way to take pictures without it feeling awkward and rushed, this design changes that by adding simple but crucial modifications.
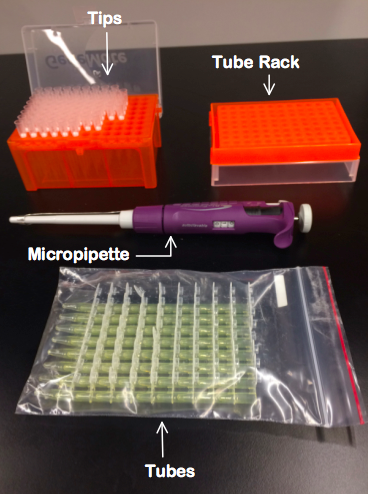
Feature 1: ConsumablesConsumables Kit- Items Included: 1. Micropipette 2. Tips 3. Tubes 4. Tube rack 5. PCR mix in separate vials 6. Primers in separate vials
Our product will also come with a consumables package that includes a micropipette, tips, tubes, a tube rack, PCR mix in separate vials, and primers in separate vials. These items have been deemed the most important consumables. It is expected that the client will provide other supplies including lab coats, gloves, and goggles. Our consumables package differs from the lab because it will all be included in one package, rather than individually acquired. We have not made major changes to our Open PCR machine, and the changes we did make to the Fluorimeter did not affect the individual products in our consumables package. Below is a sample of the products that will be included in our device, excluding the PCR mix and primers, which are not shown.
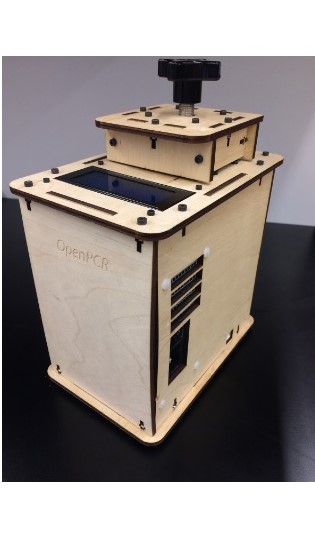
Feature 2: Hardware - PCR Machine & FluorimeterThe Open PCR machine itself remains unchanged in the design that the group came up with. The fluorimeter was modified to include several new features that allow for easier and less complicated use. The entire system works in almost exactly the same way as before, but the major adjustments that were made to the outer cover and the addition of ridges to hold the box in place serve to increase the accuracy and consistency of the results by eliminating a large amount of the possible human error. This aids in the analysis of the PCR images, because it provides a standard distance and position across all images. The improved designs of the flourimeter imaging device can be seen in the previous 3D Design section. | |||||||||||||||||||||||||||||||||||||||||||||||||||||||||||||||||||


