BME100 s2017:Group7 W8AM L3
| Home People Lab Write-Up 1 | Lab Write-Up 2 | Lab Write-Up 3 Lab Write-Up 4 | Lab Write-Up 5 | Lab Write-Up 6 Course Logistics For Instructors Photos Wiki Editing Help | |||||||||||||||||||||||||||||||||||||||||||||||
OUR TEAM
LAB 3 WRITE-UPDescriptive Stats and Graph  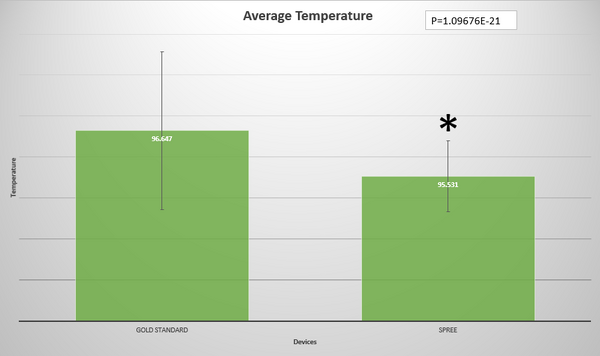 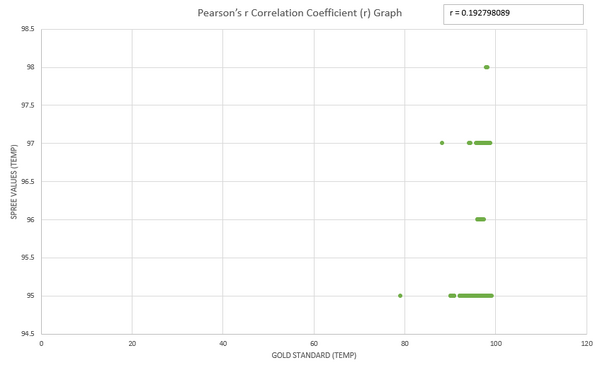
Temperature values
Inferential StatsT-Test Values
Design Flaws and RecommendationsSummary for Temperature
The Spree Band was shown to be inaccurate when compared to the Gold Standard for temperature. The Spree Band has an average value of 95.53 degrees fahrenheit compared to the average value 96.65 degrees fahrenheit for the Gold Standard. The standard deviation of the Spree Band was 0.8704 and the standard deviation for the Gold Standard was 1.9226. This displays the disparity between the deviation of the value and shows that the Spree Band is inaccurate. The standard error of the Spree Band was 0.0484 and the standard error for for the Gold Standard was 0.106811; the difference between the two different values of standard error displays, surprisingly, that the Spree Band measurements stay closer to the mean. The paired t-test value was 1.09676e-21, which is significantly smaller than 0.05, thus displaying that there is no correlation. The Pearson’s Correlation was 0.192798089 which displays that there is no correlation between the two variables once again. The calculated T-Test Value along with the Pearson’s Correlation Coefficient, r, together display a drastic difference between the two thus exhibiting that the Spree Band is unreliable.
Experimental Design of Own DeviceIf we were to run an experimental design of our own, we would use a transcranial doppler ultrasound as the gold standard to compare our device to. This device is what is used currently to detect if someone is having an ischemic stroke. It is also used to determine if the medication/operation is working by showing when blood flow to the brain is returning to normal. A solid sample size we would shoot for is about 500 patients; 250 using transcranial doppler ultrasound, and 250 using our doppler ultrasound device to detect whether or not a stroke is happening. The reason for the 2 groups is to keep the experiment as controlled as possible considering the fact that we would more than likely be unable to use one patient to test both devices. This is due to the fact that a single patient most likely will not have more than one stroke during the time frame of the study. After the study is completed we would compare the results of the transcranial doppler ultrasound and the doppler ultrasound patch with an unpaired T-test. We would hope that the p value is greater than .05 to show that there is a correlation between the two devices. A correlation would indicate that our device is at the same level as the gold standard and can act as an accurate test in determining when a stroke is occurring.
| |||||||||||||||||||||||||||||||||||||||||||||||


