BME100 s2017:Group6 W8AM L3
| Home People Lab Write-Up 1 | Lab Write-Up 2 | Lab Write-Up 3 Lab Write-Up 4 | Lab Write-Up 5 | Lab Write-Up 6 Course Logistics For Instructors Photos Wiki Editing Help | ||||
OUR TEAM
LAB 3 WRITE-UPDescriptive Stats and Graph
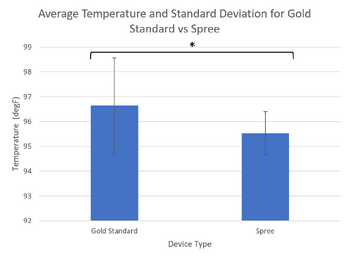
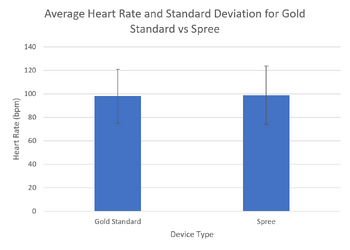
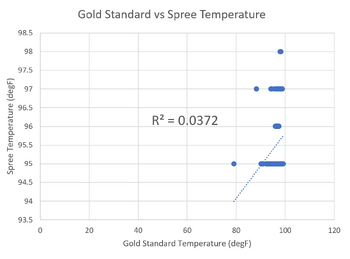
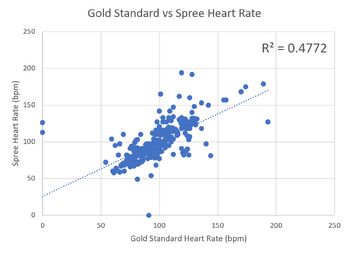
Inferential StatsIn order to test for statistical significance we ran a dependent (paired) t-test. We did this because we had one group of students that were tested in two different ways. Upon performing the t-test on the heart rate statistics between the gold standard using a pulse oximeter and the Spree Band, we found a p-value of 0.427. Upon performing the t-test on the body temperature statistics between the Gold Standard using the oral thermometer and the Spree Band, we found a p-value of 1.097*10^(-21). A p-test value of less than .05 shows a statistically significant difference. Since the p-test value for the temperature was far below this value, it is highly likely that the Spree Band does not give an accurate readout of body temperature. Design Flaws and RecommendationsA major flaw in Spree Sports device is the temperature aspect. Compared to other devices, it is unreliable in the sense that it does not provide a constant reading and that it is not always accurate. Ways to improve this aspect of the device include: figure out the best places on the body to measure temperature; use one of these spots for the device to measure or to completely disregard the temperature aspect of the device. Although it is a good aspect to have on a device like this, finding body temperature is done best when found internally instead of externally. However, if they were to continue the temperature readings, it would be best to look into more high tech temperature sensors to use for the device. Experimental Design of Own DeviceIn order to test the accuracy and validity of our device, we have decided to design an experiment that compares our pressure sensor insole to a highly accurate force plate device, such as the AMTI AccuGait Walkway. This device is designed to read the pressure distribution of a person's feet as they walk over it in order to give feedback on gait. This is essentially the same function of our device. To compare our device to the gold standard, we will have subjects walk with our insole in their shoes and gather the data. We will then have the same subject walk across the force plate, and gather the data from that. After that, we will analyze the readouts of both devices and compare force on various specified points of the foot. We will then perform statistical analysis and find standard deviation for the various points of the foot we have chosen, comparing the gold standard to our device. In order to control the experiment, we will only change the device the patients are walking on, and keep all other variable's the same (including clothing of the patient, and time of tests in case of weight fluctuation). To randomize the experiment, we will use a variety of subjects, ranging in age, weight, and body type. To repeat the testing, we will have a multitude of subjects, as well as have each subject tested multiple times. | ||||


