BME100 s2017:Group6 W1030AM L6
| Home People Lab Write-Up 1 | Lab Write-Up 2 | Lab Write-Up 3 Lab Write-Up 4 | Lab Write-Up 5 | Lab Write-Up 6 Course Logistics For Instructors Photos Wiki Editing Help | |||||||
OUR COMPANY
Our Brand Name LAB 6 WRITE-UPBayesian StatisticsOverview of the Original Diagnosis System Seven groups each analyzed two samples, leading to a total of fourteen patients diagnosed. To minimize error, three replicates of each patient's DNA were analyzed, and each group also performed PCR and fluorimetry on a positive and negative control. In total, each lab group analyzed eight samples: positive control, negative control, three samples for patient 1, and three samples for patient 2. To achieve proper calibration and minimize error, the ImageJ software was calibrated by analyzing photos of a drop of water. Additionally, to minimize statistical error in the analysis of DNA samples, three photos of each unique sample were taken and analyzed. When compared to the doctor's diagnoses, which are assumed to be correct, eleven of the fourteen conclusions reached in lab were consistent with the final diagnosis. Of the three inaccurate conclusions, one false positive, one false negative, and one inconclusive result for a negative diagnosis were reached. In total, three out of fourteen patients were diagnosed as positive by the doctor. Much of the error in the experiment stemmed from difficulty in accurately using the fluorimeter technology. Specifically, the camera stand was not a proper size to hold the smartphone in a secure position, and adjusting the camera to the correct height was difficult with the given equipment. Furthermore, analysis of the photos was difficult due to the unreliability of the ImageJ software, which repeatedly crashed, causing previous data to be lost. What Bayes Statistics Imply about This Diagnostic Approach
The use of Bayesian calculations can help to determine the reliability of a person having the disease SNP. In calculation 1 the probability of a positive PCR reaction given a positive final test conclusion was around 70%. The probability of a positive final test conclusion given a positive PCR reaction was only about 50%. These are not ideally reliable but Bayesian calculations are not always accurate. In calculation 2 however, the probability of a negative diagnostic signal given a negative final test result were around 90 to 100%. Calculation 2 shows just how reliable this particular course of testing for a disease can be.
Overall, PCR can be said to be moderately reliable when attempting to predict if the disease will develop or not due to a vast span of probabilities. In Calculation 4, the results showed about 90%, indicating that there is a high probability the patient will not acquire the disease due to a negative final test result. In this case the PCR Results can be said to be pretty reliable. Contrarily, the PCR machine was less reliable when predicting for Calculation 3. Calculation 3 was close to 25%, indicating a low probability of the patient developing the disease due to a positive test result. All in all, the PCR machine was less reliable when it came to predicting the development of the disease, however, much more accurate when predicting the disease.
Of the main possible sources of Human error, the most common could be not setting up the machine correctly, or a possible cross-contamination from one sample to the other. Of course, precautions are taken to make sure that this will not occur, but the chance is always their. Then there is the error of using the wrong numbers, whether by forgetting an integer, or just confusing one set of data for another. This would throw off the data and would skew results. Another was that the use of image J was very eyeball, and the software limited the exact form that the oval could take, and sometimes there was a bit of empty space in the oval, resulting in the numbers differing by a small amount. But since there was more than one picture taken of the sample, it would average out and end up with consistent results. Intro to Computer-Aided Design3D Modeling
Feature 1: ConsumablesOur consumables kit will include:
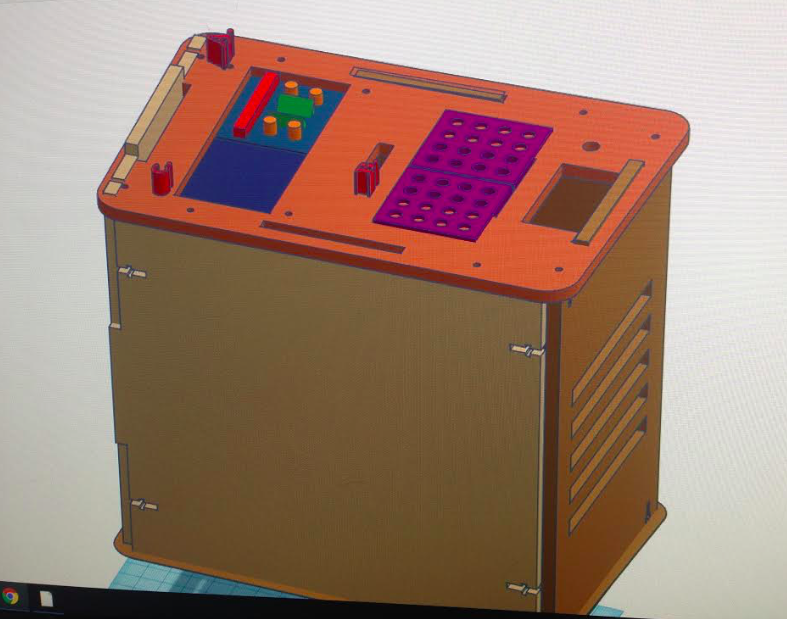
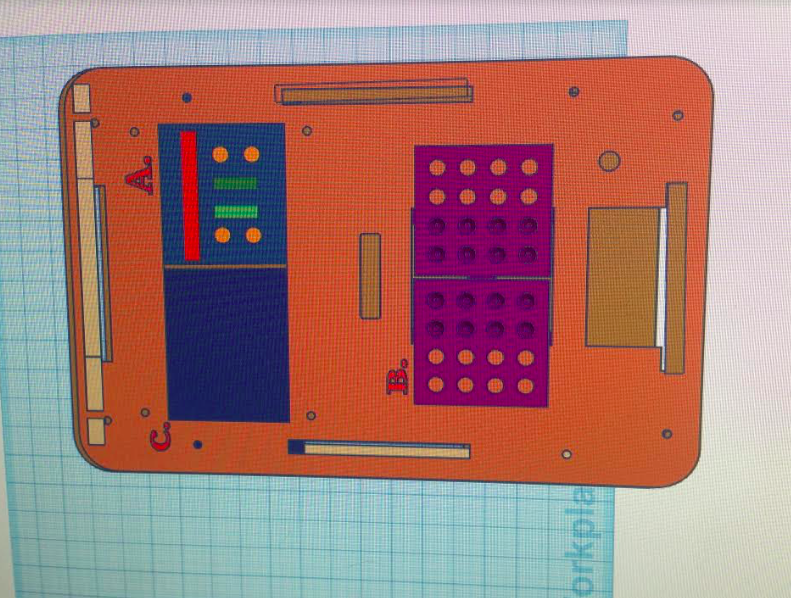
One weakness in the consumables kit was difficulty in labeling the micro-tubes for specific groups and samples with masking tape. This labeling is necessary to distinguish the samples within a group and between groups, particularly considering the fact that the Open PCR machine required two groups' samples in the machine to run. By including small adhesive labels with a pre-cut size conducive to the microtubes, customers will be able to write identifying information and easily attach it to their microtubes before running PCR. Feature 2: Hardware - PCR Machine & FluorimeterAn issue that slowed the process of running PCR in lab was the requirement to wait for another group to add their tubes to the PCR machine, because the machine could only run with the total 16 tubes inside. A change that could be made to the PCR machine would be to increase the size of the machine to accommodate 32 tubes, but to have settings that could allow the PCR to successfully run even without the required number of tubes (e.g. slight temperature adjustments if there are 8 tubes, or 16, or 32, etc.). Additionally, the PCR machine could be used more simply and conveniently if the settings for the timed temperature cycles were integrated into the PCR machine rather than requiring that these settings be adjusted on a computer connected to the PCR machine. This adjustment would include a small screen and buttons to adjust up and down for temperature and for time, along with toggle buttons to select cycles to adjust in the PCR process. A major issue in the Fluorimeter was the stand. Measuring the distance between the stand and the Fluorimeter by hand is inaccurate and hard to keep consistent. A 10cm long adjustable ruler that connects the stand to the Fluorimeter will keep the distance fixed and hold them both in place better. The size of the stand also became a problem during the lab because the slot to put the phone into was larger than it should be. To improve this, making the slot with four adjustable screws can allow any phone to fit into it as well as hold the phone in place. Adding to that, the height of the Fluorimeter was not enough to meet the camera of the smart phone. An adjustable lift to put directly underneath the device will allow for the camera to be in a more ideal spot as well as take better photos. The last issue with the Fluorimeter was that there was no indicator as to where the droplet should go. To make the positioning as accurate as possible, adding an indicator in order to place the droplet in the right spot will make the pictures easier to take and the changes easier to see.
| |||||||


