BME100 s2017:Group2 W8AM L5
| Home People Lab Write-Up 1 | Lab Write-Up 2 | Lab Write-Up 3 Lab Write-Up 4 | Lab Write-Up 5 | Lab Write-Up 6 Course Logistics For Instructors Photos Wiki Editing Help | ||||||||||||||||||||||||||||||||||||||||||||||||||||||||||||||||||||||||||||||||||||||||||||||||||||||||||||||||||||
OUR TEAM
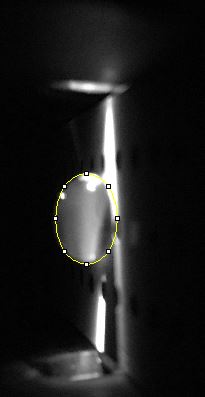
LAB 5 WRITE-UPPCR Reaction ReportThe PCR pipetting experience went well because our designated pipettor had previous experience using a micropipettor. The pre-lab reading was a good refresher and helped everyone to better understand micropipetting. The difference between the first and the second stop on the pipettor was clear after some practice. The final amount of liquids in the final PCR tubes was the same, but the amount left in the PCR reaction mix and DNA sample tubes varied a little. The labeling scheme was slightly changed to fit the whole label on the tubes. Fluorimeter ProcedureImaging set-up To set up the fluorimeter, a glass slide was placed with the smooth side down in the fluorimeter and then turned on. The smartphone was placed on a stand and the height of the fluorimeter was adjusted until the camera was parallel to the side of the slide. Then, 80 microliters of the SYBR Green I solution and 80 microliters of pure water were added to the middle of the first two rows on the slide. The slide was adjusted until the solution was in line with the light of the fluorimeter. The distance of the camera to the drop of solution was adjusted until the image on the camera was clear. Finally, the light box was placed over the fluorimeter/ camera set up and the timer of the camera was turned on. This was repeated for the 5 different positions on the slide. Placing Samples onto the Fluorimeter
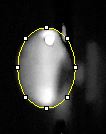
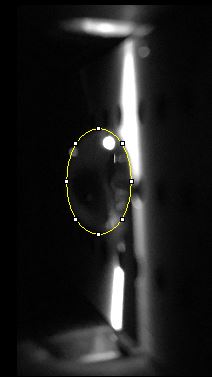
Data Collection and AnalysisImages of High, Low, and Zero Calf Thymus DNA
Images of Our PCR Negative and Positive Controls
Observed results
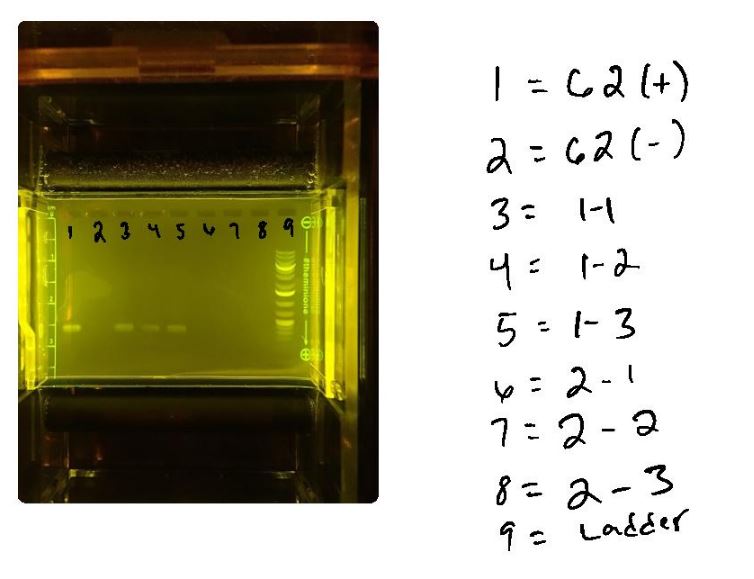
The numbers on the electrophesis gel image correspond to which DNA sample was put into each well. The samples were marked and prepared for the electrophesis in the previous lab and the numbers on the image correspond to the PCR Reaction samples of the two patient samples received during that lab. Well 1 contained G2 P, the positive control and Well 2 contained G2 N, which was the negative control. Wells 3-8 contained the reaction samples of Patient 1 and 2 and three replicas for each. That being said, Well 3 contained G2 1-1, patient 1, replica 1, Well 4 contained G2 1-2, patient 1, replica 2, Well 5 contained G2 1-3, patient 1, replica 3. The samples for patient 2 started at Well 6 which contained G2 2-1, patient 2, replica 1, and continued with Well 7 which contained G2 2-2, patient 2, replica 2, and Well 8 contained G2 2-3, patient 2, replica 3. The last well, Well 9, contained the ladder, which helped to compare the 8 true PCR samples.
|
||||||||||||||||||||||||||||||||||||||||||||||||||||||||||||||||||||||||||||||||||||||||||||||||||||||||||||||||||||


