BME100 s2017:Group1 W8AM L6
| Home People Lab Write-Up 1 | Lab Write-Up 2 | Lab Write-Up 3 Lab Write-Up 4 | Lab Write-Up 5 | Lab Write-Up 6 Course Logistics For Instructors Photos Wiki Editing Help | |||||||
GROUP 1
accurDNA' LAB 6 WRITE-UPBayesian StatisticsOverview of the Original Diagnosis System To test patients for the disease-associated SNP, the BME 100 class was divided into seventeen groups of approximately six students each. Each team was assigned two patients, totaling in thirty-four patients being diagnosed. Each patient's DNA was replicated three times. This was done to avoid giving a patient an incorrect diagnosis. Other measures were taken to reduce error, such as comparing results to both positive and negative data. A drop of green dye was dropped into the DNA to make the results more visible. The software ImageJ was then used to compare patients to the control data. ImageJ was extremely useful because it did the calculations that cannot be done by merely observing with the naked eye. ImageJ was used on three pictures of each sample to prevent error. Patients who had the disease SNP had drops that turned green. Those who were negative did not change colors. As a class, there was twelve patients that tested negative, six that tested positive, and two results were inconclusive. None of the tests had blank data. One source of error could have been mixing up pictures before using ImageJ. Another could have included mislabeling samples. What Bayes Statistics Imply about This Diagnostic Approach
The probability that a patient will develop the disease given a positive final test conclusion is close to 100%. Once again, the test is somewhat reliable but there is still room for improvements. The probability that a patient will not develop the disease, given a negative test conclusion is between 50% and 100%. The test is more likely to be right than wrong, but there is still a one in four chance of the results being wrong, making it a somewhat unreliable test. One possible human error would be mislabeling samples and misdiagnosing patients. Another source of error could have been losing some sample during the transfer from one container to another. A third error could result from poor image quality. Intro to Computer-Aided Design3D Modeling

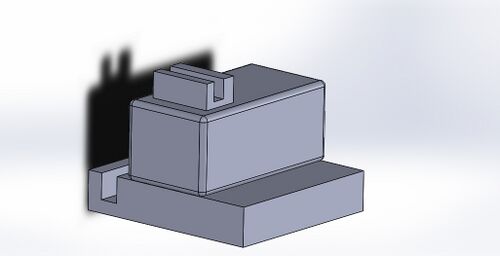
Feature 1: ConsumablesCONSUMABLES KIT: Feature 2: Hardware - PCR Machine & FluorimeterOur original fluorimeter system was not efficient in producing accurate results, as they had to be read with the naked eye. Our new fluorimeter will upload pictures directly into the connected computer and analyzed immediately. Secondly, the components of the fluorimeter will be directly attached to the base of the device rather than simply placed on it. This will allow for less movement between camera shots and will avoid possible confusion as to where the parts should be placed. Finally, our new system will implement a new camera with a higher ISO instead of using a cell phone camera so that fluorescence in the sample can be more easily identifiable. Our new OpenPCR machine will incorporate slightly larger components that are directly interacted with so that these interactive components would be easier to handle while still maintaining the compact design of the machine. In addition, a new, more responsive heat system will be used to heat the chamber, speeding up the PCR process. Wheels will be added to the bottom of the machine to increase portability at the lab station, and a reinforced steel frame will be added to the wood of the device to increase durability. Finally, the position of the large cooling system inside the machine will be adjusted so that the size of the machine can be compacted further.
| |||||||


