BME100 s2017:Group1 W8AM L5
| Home People Lab Write-Up 1 | Lab Write-Up 2 | Lab Write-Up 3 Lab Write-Up 4 | Lab Write-Up 5 | Lab Write-Up 6 Course Logistics For Instructors Photos Wiki Editing Help | |||||||
OUR TEAM
LAB 5 WRITE-UPPCR Reaction ReportOur team had a very positive experience with pipetting the sample sets for the reaction. The pre-lab reading helped us understand it, as well as the youtube videos, especially because none of us had used a micropipetter before. The final reactions had the same amount of liquid left, and the reaction mix tubes had similar amounts of liquid left, which was not very much. Our labeling scheme was not changed, we just had to ensure that we were labeling on the side of the tubes and not the top. Fluorimeter ProcedureImaging set-up First, the flash on each camera was turned off to not produce any extra light. Next, the ISO was raised to adjust the camera to low light. Since iPhones were used in the process, the exact ISO could not be set to a value. Instead, we adjusted the brightness of the shot to an optimal setting. After the image was taken, the exposure and saturation were both set to he maximum setting, the contrast was set to the minimum setting, and the white balance was set to automatic.
Placing Samples onto the Fluorimeter Step 1: A 160 μL drop of water was placed onto the fluorimeter slide using a pipettor, in which the DNA samples would be added later. Step 2: The excitation light was turned on Step 3: The camera was turned on on our smartphones and prepared as described in the above section. Step 4: Our smartphones were placed onto the holder in a landscape position so as to effectively capture the blue light from the drop. Step 5: The distance between the phone and the drop was adjusted such that the phone would be as close to the drop as possible without blurring the picture.\ Step 6: The distance between the phone and the drop was measured with a ruler and recorded. Step 7: An 80 μL drop of SYBR GREEN I was placed on the slide, and a 80 μL drop of one of the calf thymus solutions was added to the drop. Step 8: The slide was aligned so that the drop received the most light from the blue LED light. Step 9: A timer was set on the smartphone camera so that we could have time to place the light box over the sample. Step 10: Three pictures of the drop were taken. Step 11: The box was removed and any variables that were adversely adjusted were restored. Step 12: The pipettor was set to remove the 160 μL drop from the slide so that the slide could be adjusted for the next sample. Step 13: Steps 7-12 were repeated for each concentration of calf thymus solution.
[[]]==Data Collection and Analysis== Images of High, Low, and Zero Calf Thymus DNA 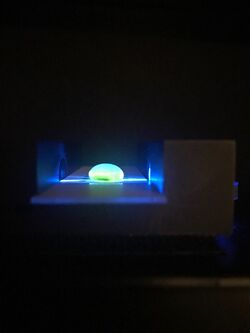 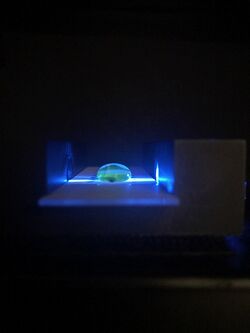 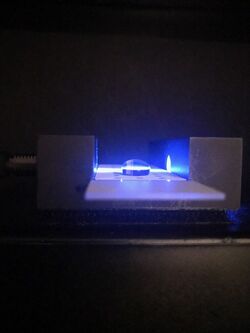

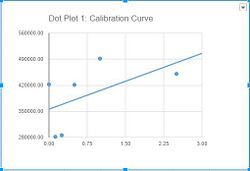 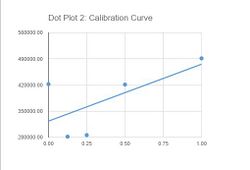
Images of Our PCR Negative and Positive Controls 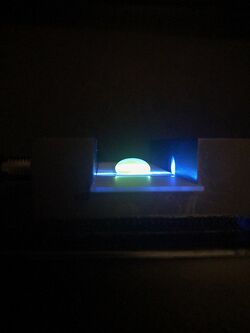 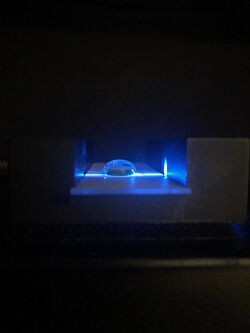

PCR Results: Summary
Extra Credit: Electrophoresis Gel
| |||||||


