BME100 s2017:Group1 W1030AM L6
| Home People Lab Write-Up 1 | Lab Write-Up 2 | Lab Write-Up 3 Lab Write-Up 4 | Lab Write-Up 5 | Lab Write-Up 6 Course Logistics For Instructors Photos Wiki Editing Help | |||||||
OUR COMPANY
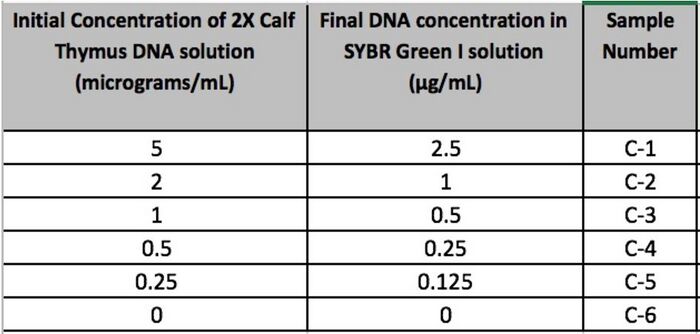
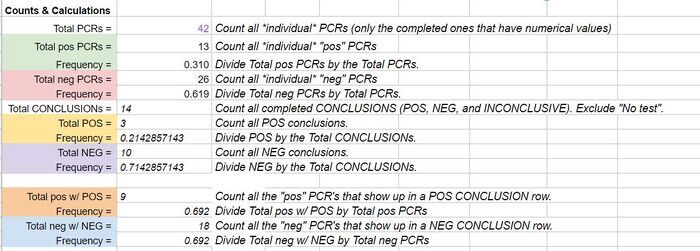
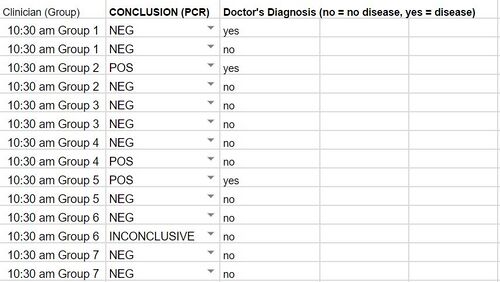
GloPro (PCR Software) LAB 6 WRITE-UPBayesian StatisticsOverview of the Original Diagnosis System This BME100 lab class tested 34 patients for a specific disease-associated SNP, rs121908757. This SNP is associated with a pathogenic condition that causes cystic fibrosis. The final results of the 34 patients were to be reviewed using Bayesian Statistics so, the patients were divided into 17 teams of 6 students each. Each team was in charge of testing two patients. Within each team the labor was divided up between the different tests. Two people worked on the drop fluorimeter, two worked on the imageJ and two worked on the gel electrophoresis. Each test performed would be done in duplicates using the patient's DNA. This was done in an attempt to fend off any errors in the results. By testing two replicates of each patient’s DNA, all the test data was backed up with a secondary test result. The additional results help to reduce the chances of having a false positive or negative. Other elements of the experiment where practices were put into place to reduce error were the PCR controls, ImageJ calibration controls, and the number of drop images that were used for the ImageJ calculations. To reduce error when working with the PCR controls, a minimum of two people were involved in the pipetting and mixing procedure. The additional eyes on the experiment gave an added level of supervision and provided a person who was able to read the instructions back from the instruction manual provided. This double checking of procedure aided in reducing error as well as checking in with the professor and TA’s to ensure proper protocol was being performed. For the imageJ calibration controls there were five sets of data to compare the DNA results to. There was a positive and negative control as well as the high, low and no DNA content samples. In the below image you can see the mean calibration values that were used to create a series of calibration curves. The calibration curves were used to compare data results to to ensure as little error as possible for the experiment. : Lastly, to reduce error potential when conducting the diagnosis using the imageJ, after the full calibration was complete, there were multiple images taken and analyzed of each drop. Each image was compared to check consistency of the result and then the best selected match was compared to the positive and negative control test results. There were also comparable control tests with high, low and no DNA to compare the imageJ results to. There were a minimum of 2 images per patient tested using the imageJ procedure. As a whole the class's final data from the BME100_Fa2015_PCRresults spreadsheet can be seen below. For the two patients our group was assigned, the test results matched up with each other and the gel electrophoresis results. There were some challenges that could have potentially affected the data. Mostly minor inconveniences but nonetheless challenges such as the difficulty behind capturing successful images with the drop fluorimeter aparatus. What Bayes Statistics Imply about This Diagnostic Approach The results of calculations 1 and 2 conclude that a chance for the patient to not have the disease is about 30% Positive PCRs and 60% Negative PCRs. And the number of POS (Patient who is expected to carry the SNP disease) conclusions is about 20% while the NEG (Patient who is not expected to carry the SNP disease) conclusions is about 70%. Concluding that the correlation between the PCR test and the conclusion are pretty closely related. When looking at the doctor’s diagnosis of the 2 patients they both had a conclusion of NEG but the doctor diagnosed one patient as having the disease and one patient did not. So, this test was not very reliable when comparing them to the actual diagnosis. Given the diagnostic results, a comparison of positive final test conclusions and PCR reactions can be established. There is an approximately 50% probability that a positive PCR reaction will be registered as a positive final test conclusion by our means of analysis. There is an approximately 70% probability that a negative PCR reaction will be registered as a negative final test conclusion. The chances that a negative PCR reaction is registered as positive is less than the chances that a positive PCR reaction is registered as negative, but there is still a statistically significant probability of false positives and undetected positives, making the reliability of individual PCR replicates very low in their positive or negative conclusions.
Intro to Computer-Aided Design3D Modeling
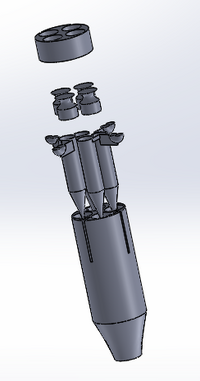
Feature 1: ConsumablesThe newly designed micropipettor does not change the abilities or effectiveness in any of the preexisting consumables in the kit. The new micropipettor is addressing the issue with the Open PCR machine. The term “very important”, when describing the consumables in it kit, means the non-machine supplies that is needed in order to work the newly designed system right out of the package. Our design includes the traditional consumables in our packaged kit, but with the addition of a newly designed consumable: colored rings around the microtubes. Therefore, the new kit will include the traditional consumables needed in for the Open PCR machine as well as implementing the newly designed colored rings added on the outside of the microtubes that helps to label and keep track of the different microtubes for different concentrations: -Primer Solution -PCR mix -Microtubes -Buffertubes -Buffer Solution -Micropipette -20 Red Colored Microtube Rings -20 Blue Colored Microtube Rings -20 Green Colored Microtube Rings -20 Orange Colored Microtube Rings -20 Purple Colored Microtube Rings -20 Yellow Colored Microtube Rings -20 Pink Colored Microtube Rings
One major weakness that our consumables packaging plan is trying to address is the poor labeling of the microtubes. We plan to address the issue in our packaging by including microtubes that have removable colored rings on the outside. These rings will correspond with the specific group or concentration mixed. We feel by giving 10-20 rings of each different colors the user will be able to clearly distinguish which color applies to which sample and for who. The rings will be removable to change the colors if need be. In using these color rings it will be easy to assign a color to a group and not hassle with writing on any labeling. This can also appeal to the younger generations that use this kit because it is colorful and a great way to distinguish the concentrations in the microtubes.
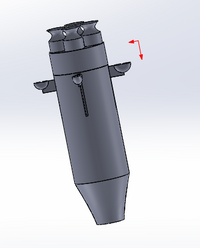
Feature 2: Hardware - PCR Machine & FluorimeterWith the micro pipette it was a lot of going back and forth trying to remember each step as you went along trying hard not to cross contaminate anything. With our multi micro pipetter it eliminates some of that risk as well as to help speed up the process of having to transfer all of the different consumables. Dealing with the PCR and fluorimeter, similar to the lab both pieces will be needed, but our design will only be changing the PCR machine. It is a slight adjustment to the PCR machine but we believe that there is a way to improve the way that this lab could be done. For the PCR one of the major components to it was the fact that it took a while for the process to take place in the PCR machine. The set up and machine was straightforward, but one design idea that we thought would benefit the system would be to better be able to tell when the machine had finished. This is why we thought it would be beneficial to add lights on top of the PCR machine to show when the machine was done and indicate at a clear time that the DNA can be removed and then continue through the rest of the process.
| |||||||


