BME100 s2017:Group10 W8AM L3
| Home People Lab Write-Up 1 | Lab Write-Up 2 | Lab Write-Up 3 Lab Write-Up 4 | Lab Write-Up 5 | Lab Write-Up 6 Course Logistics For Instructors Photos Wiki Editing Help | |||||||
OUR TEAM
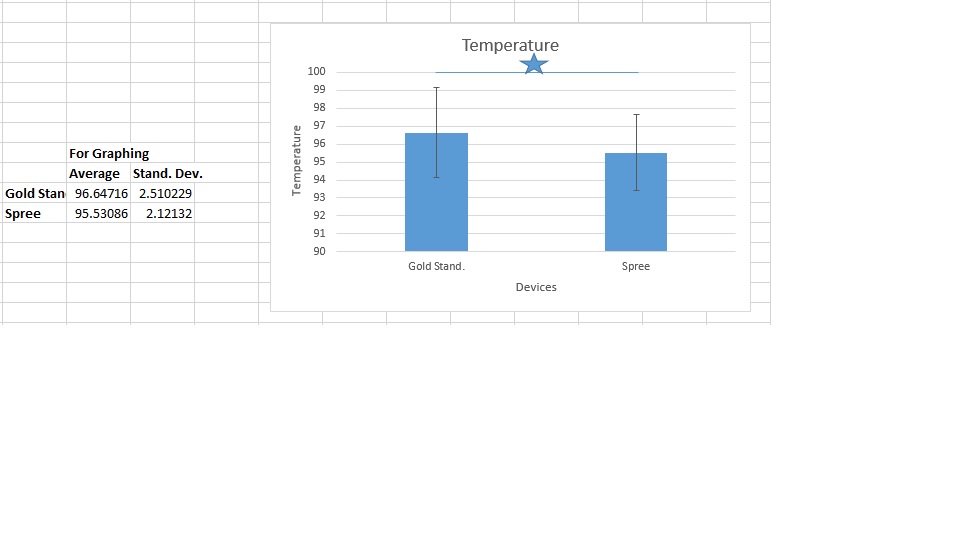
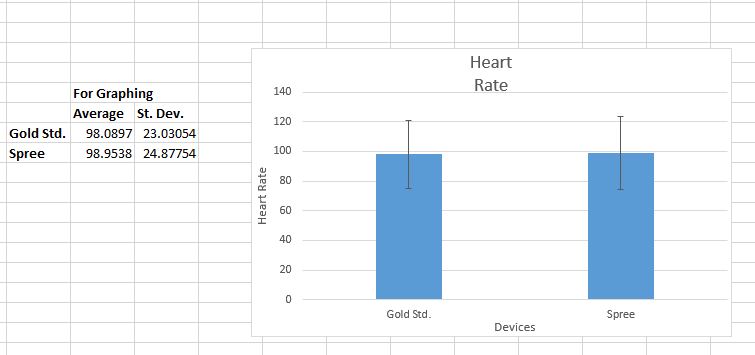
LAB 3 WRITE-UPDescriptive Stats and GraphTemperature Heart Rate
Inferential StatsTemperature Summary of Statistical Results and ConclusionsThis lab investigation required the lab group to compare and analyze the results of an experiment that evaluated the accuracy of the Spree temperature and heart rate monitoring device against the Gold Standard measurement devices. The group found that the correlation coefficient between the two devices when tracking heart rate was 0.6908, indicating that the Spree device was fairly accurate compared to the Gold Standard pulse ox. However, the correlation coefficient between the oral thermometer and the Spree headband was only 0.1927, meaning that there was very little correlation and therefore minimal accuracy. The p-value for the data concerning temperature readings was 1.09E-21, which is extremely small, and thus further indicates that the data is too different to be significant. If the p-value for two data sets is smaller than 0.05, then the data is significantly different and therefore is an indicator of poor accuracy between the data sets. The p-value for the heart rate data was 0.427, which is much greater than 0.05, so it is a sign that the data is not so different that it is statistically significant. This is a good sign when comparing data sets. From this calculated data, it can be concluded that the Spree headband is not accurate when it is monitoring body temperature, but that it is fairly accurate when tracking heart rate.
Experimental Design of Own DeviceBefore any testing is done the patients' fasted glucose levels would be measured. This level can be recorded after the patient has not eaten for a period of approximately 8 hours. This can typically be measured immediately after a patient wakes up in the morning. After measuring the fasted glucose, the unique amount of insulin that each individual patient needs can be determined. At least twenty people would be needed to participate in the first stages of the clinical trial. The experiment would be done by having the patient wear the designed insulin patch that will inject insulin for them. The patients will be tested hourly for their glucose levels in the first 8 hours then measured every 2 hours for the next 8 hours. After the initialization period the patient's glucose levels will be monitored twice a day to check the effectiveness of the device. The patients wear the device in everyday life for a week long period. After the test is completed each patient will fill out a comprehensive review sheet based on their satisfaction.
| |||||||


