BME100 s2014:W Group6 L5
| Home People Lab Write-Up 1 | Lab Write-Up 2 | Lab Write-Up 3 Lab Write-Up 4 | Lab Write-Up 5 | Lab Write-Up 6 Course Logistics For Instructors Photos Wiki Editing Help | |||||
|
OUR TEAM
LAB 5 WRITE-UPBackground InformationSYBR Green Dye
ProcedureSmart Phone Camera Settings
Calibration In order to calibrate the system, place the iPhone 5 in the cradle. Ensure that the camera is almost perfectly aligned with the slide with a sample drop that is exposed to the blue fluorimeter. The fluorimeter may need to be raised so that it is close to level with the camera. This can be done using small notebooks or small plastic plates that were provided in lab. Place a box over the system, making sure that no light enters when the pictures are being taken. Make sure the camera has a timer so that the box can be closed completely before the photo is taken. This process is repeated with different sample concentrations. ImageJ is the nused to analyze these images of different samples, and the RAWINTDEN values were then recorded. These values were used to make a calibration curve, of RAWINTDEN versus half-thymus DNA concentration.
Solutions Used for Calibration
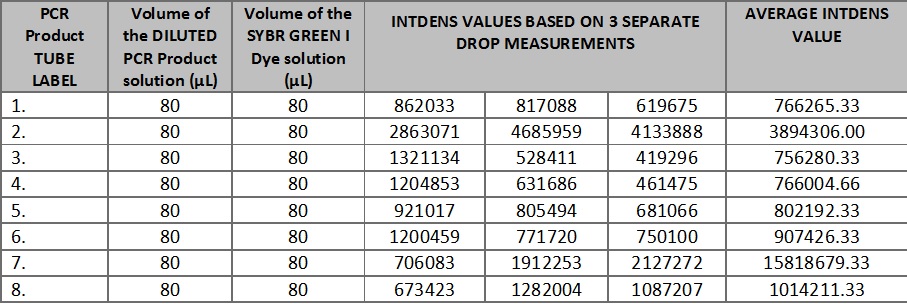
Data AnalysisRepresentative Images of Samples [Instructions: Show an IMAGE where you drew a circle around the droplet with the freehand tool for a sample with no DNA] http://openwetware.org/images/9/99/Screen_Shot_2014-04-16_at_6.35.05_AM.png [Instructions: Show an IMAGE where you drew a circle around the droplet with the freehand tool for a sample with DNA (positive signal)] http://openwetware.org/images/8/84/Screen_Shot_2014-04-16_at_6.34.53_AM.png Image J Values for All Samples [Instructions: See worksheet page 8. To save time on typing a new Wiki table from scratch, use THIS TOOL to auto-generate a Wiki table: Excel-to-Wiki Converter. Copy the headers and values from the Excel spreadsheet you made, paste them into the form field, click submit, copy the Wiki code that the tool generated, and replace TABLE GOES HERE (below) with your auto-generated code.]
[Instructions: Place an IMAGE of your Excel plot with a line of best fit here. See worksheet page 9]
http://openwetware.org/images/3/35/Calibrationcurveyolo.jpg.png Report 5 Addendum PCR Results Summary Instructor's summary: You completed 8 PCR reactions in a previous lab. You used the SYBR Green I staining and imaging technique to measure the amount of amplified DNA in each PCR reaction. You used a standard curve (based on known concentrations of calf thymus DNA) to convert INTDEN values into DNA concentration. Your positive control and negative control samples should be used as threshold values for determining whether an unknown (patient) sample is truly positive or negative. Important Note: The following concentrations are negative. While it is impossible for such measurements to be correct, they may still function as indicators of the presence of the disease by comparison to the negative and positive control. positive control PCR result was -1.18094 μg/mL negative control PCR result was -4.52187 μg/mL Write-in each patient ID and give both a qualitative (what the images looked like) and a quantitative description (μg/mL) of what you observed Patient 1 (ID: 67618): Average concentration calculated: -4.51273μg/mL. Qualitative analysis: There is no or minimum fluorescence in each image of Patient 1's DNA. Patient 2 (ID: 78379): Average concentration calculated: -4.09297μg/mL. Qualitative analysis: There is no or minimum fluorescence in each image of Patient 2's DNA. Compare each patient's results to the positive control value and the negative control value. Draw a final conclusion for each patient (positive or negative) and explain why you made that conclusion. Patient 1: The patient's average concentration of DNA is very close to the negative control. Additionally, the lack of observed fluorescence in this patient's DNA is markedly different from the positive control, which was visibly green. Therefore, Patient 1 is judged to be free of the disease (a negative result). Patient 2 : The patient's average concentration of DNA is lower than that of the other patient's, but still far closer to the negative control than the positive control. Patient 2 also lacked visible fluorescence. Therefore, Patient 2 is also negative for the disease. | |||||


