BME100 s2014:W Group6 L3
| Home People Lab Write-Up 1 | Lab Write-Up 2 | Lab Write-Up 3 Lab Write-Up 4 | Lab Write-Up 5 | Lab Write-Up 6 Course Logistics For Instructors Photos Wiki Editing Help | ||||||
OUR TEAM
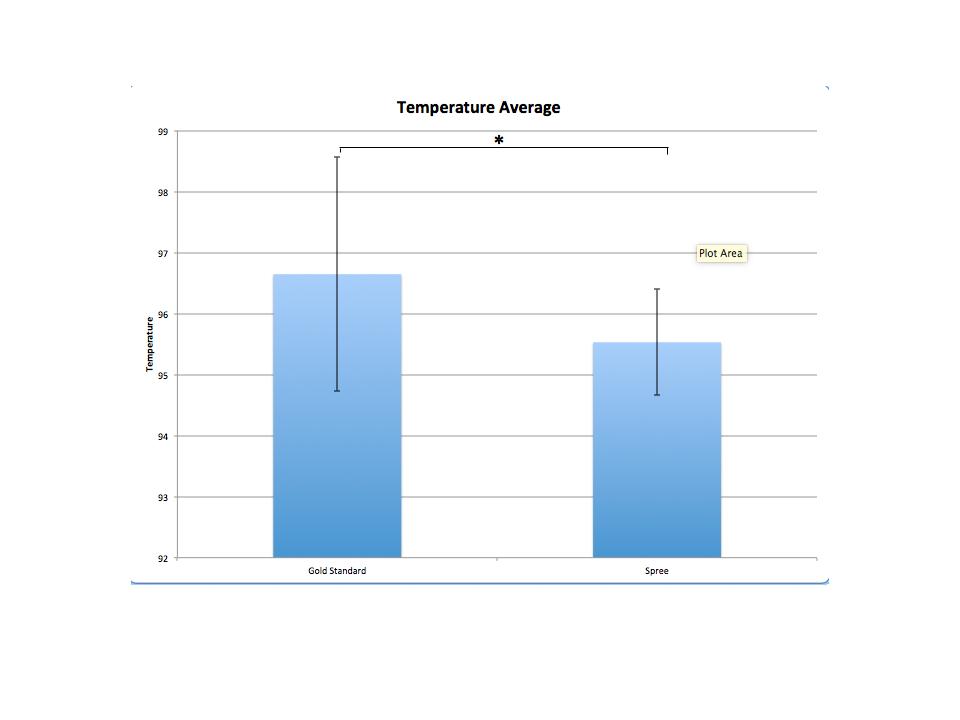
LAB 3A WRITE-UPTemperature StatisticsRAIIN SENSOR: mean value:96.495 Degrees F standard deviation:2.028 Degrees F Oral Thermometer: mean value:97.079 Degrees F standard deviation:1.076 Degrees F
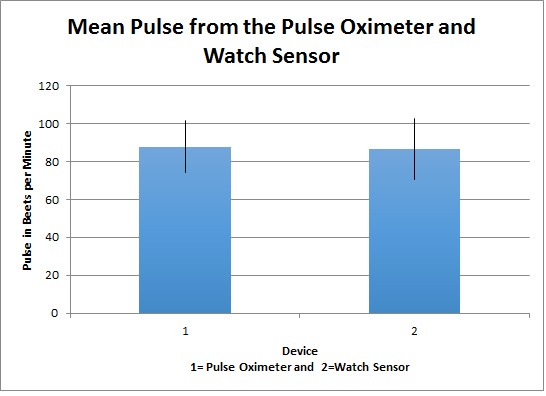
Pulse StatisticsPulse Oximeter: mean value:87.857 beats/min standard deviation:13.795 beats/min Watch Sensor: mean value:86.734 beats/min standard deviation:16.120 beats/min
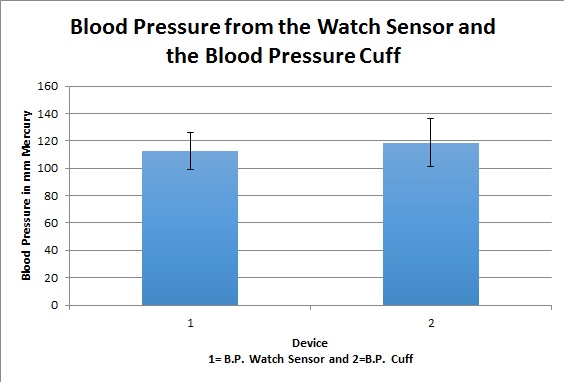
Blood Pressure StatisticsBlood Pressure Cuff: mean value: 118.696 mmHg standard deviation: 17.833mmHg Watch Sensor: mean value:112.329mmHg standard deviation:13.563mmHg
ResultsTemperature: t-test = 0.0000708 p-value = 0.50003 Blood Pressure: t-test = 0.0000243 p-value = 0.99998 Pulse: t-test = 0.1051 p-value = 0.9163
AnalysisThis lab used experimental data to compare the measurements provided by a gold standard device and the device being tested for its validity. For temperature, the t-value describing the difference between the mean body temperature measured by the oral thermometer (the gold standard) and the body sensor (the device being tested) was 0.0000708. This corresponded to a p-value of 0.50003, indicating that the difference between the two devices was not significant - the data supports the validity of the body sensor. For blood pressure, the t-value describing the difference between the mean blood pressure measured by the blood pressure cuff (the gold standard device) and the watch sensor (the device being tested) was 0.0000243. This corresponded to a p-value of 0.99998. This p-value is very high, indicating that the difference in the means was not significant - the data supports the validity of the watch sensor. For pulse, the t-value was 0.1051. The p-value corresponding to this was 0.9163, indicating that there is not a significant difference. There is not significant evidence to support the hypothesis that there is a difference in the mean for the gold standard and the device being tested in any of the three measurements.
Summary/DiscussionThe lab collected data on body temperature, blood pressure, and pulse using a gold standard device and a device of questionable validity for each measurement. This technique was used so that the mean measurement for each of the three types of data being collected could be compared so that it could be determined if there was a significant difference between the gold standard device and its corresponding untested device. This was determined using a student's T-test and by assessing the p-value corresponding to each t-value at an alpha level of 0.05. In no case was their found to be a significant difference and so it could be said that there is not sufficient evidence to reject any of the non-gold standard devices.
LAB 3B WRITE-UPTarget Population and NeedThe target population is aimed towards outdoor workers who suffer from heat stroke or heat exhaustion. In states like Arizona, the extreme heat puts people who work in construction, landscaping, etc. in great risk of heat stroke and they need something to warn them before it happens. This can be a personal use for those working outdoors on their own accords, or also by companies looking to better protect their employees.
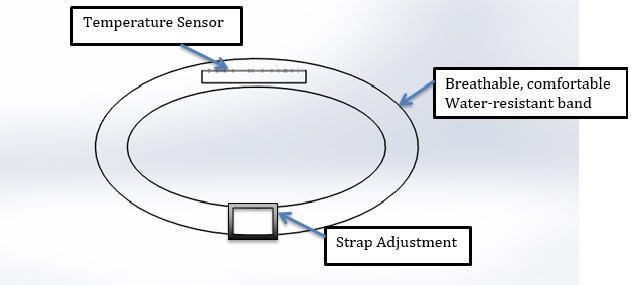
Device Design
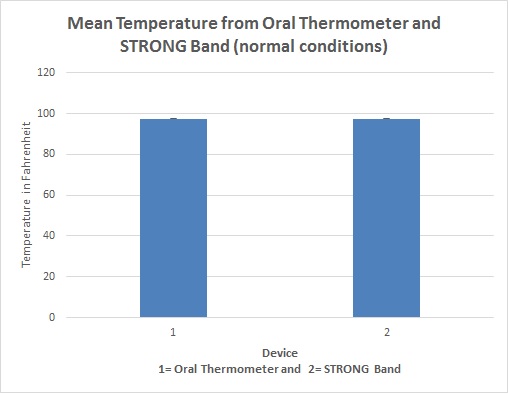
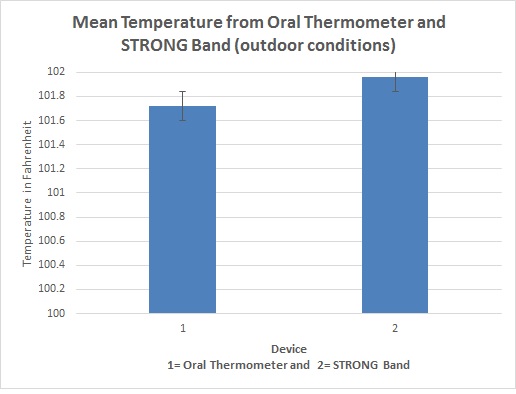
Inferential StatisticsTemperature in normal conditions: t-test=1 p-value=0.832859028 Temperature in outdoor conditions: t-test=0.00096015 p-value=0.50037627
Graph
|
||||||

