BME100 s2014:W Group3 L3
| Home People Lab Write-Up 1 | Lab Write-Up 2 | Lab Write-Up 3 Lab Write-Up 4 | Lab Write-Up 5 | Lab Write-Up 6 Course Logistics For Instructors Photos Wiki Editing Help | ||||||
OUR TEAM
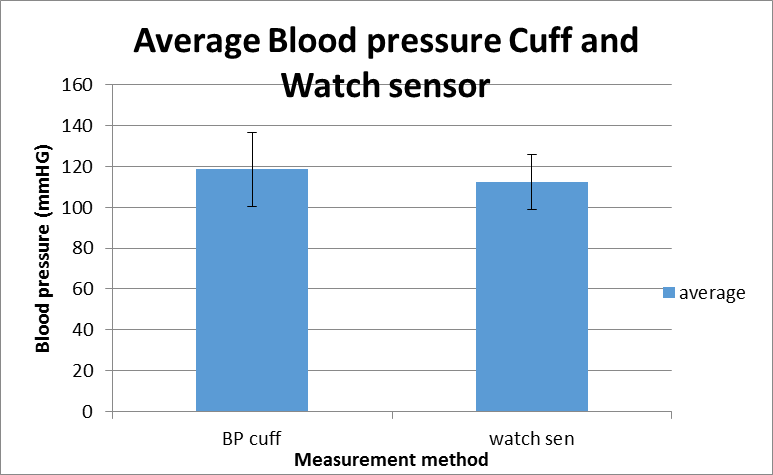
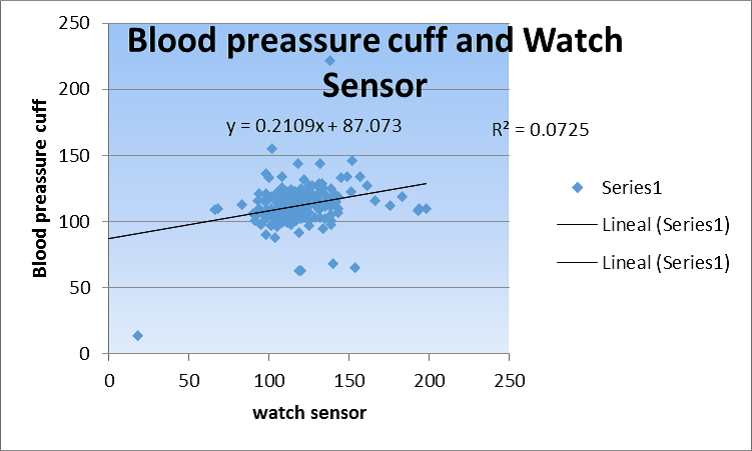
LAB 3A WRITE-UPBlood pressure cuff and watch sensor Average: Blood Pressure Cuff: 118.5 Omcron Watch Sensor: 112.3 Standard Deviation: Blood Pressure Cuff:18.1 Omcron Watch Sensor:13.5 T-Test Results: 3.720 EE -6 Pearson's R Correlation: .0725
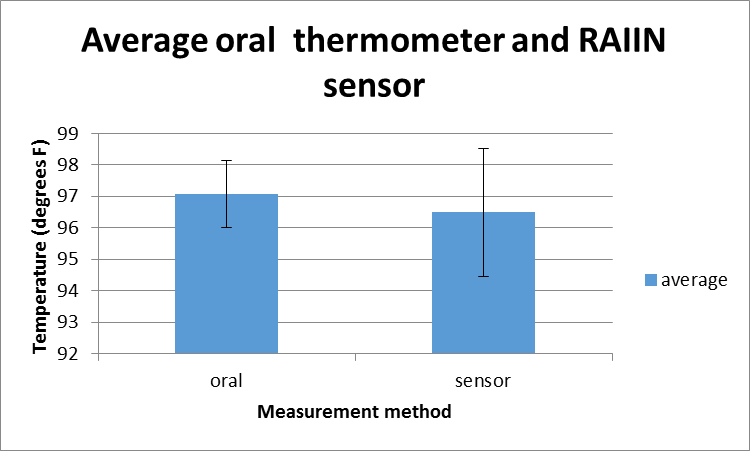
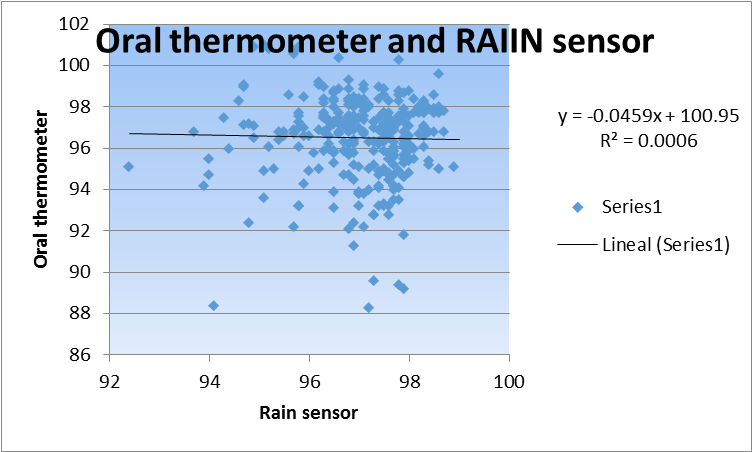
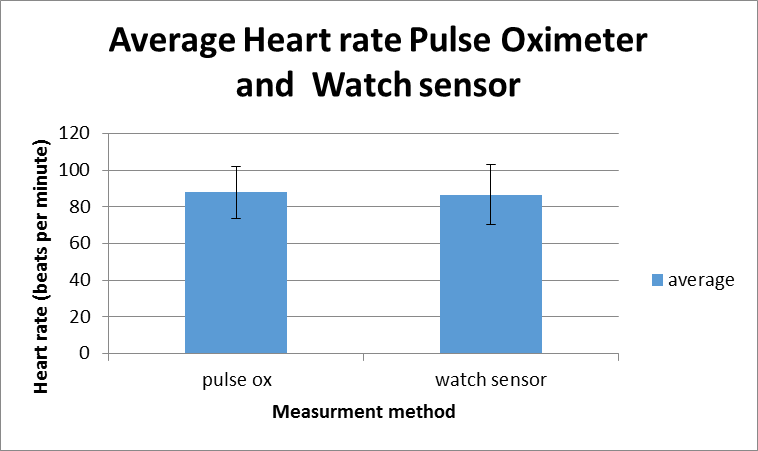
Average: Omcron Watch Sensor: 87.9 Pulse Oximeter: 86.7 Standard Deviation: Omcron Watch Sensor: 13.9 Pulse Oximeter: 16.2 T-Test Results: .3516 Pearson's R Correlation: .3047 Oral thermometer and RAIIN sensor: Average: RAIIN sensor: 96.5 Oral Thermometer:97.1 Standard Deviation: RAIIN sensor: 2.03 Oral Thermometer: 1.08 T-Test Results: 1.281 EE -5 Pearson's R Correlation: .05958 Results
AnalysisBlood Pressure: Our T-test provided a result of 3.720 EE -6 which is .000003720 which is drastically smaller than our alpha value of .05 meaning that there is a statistical difference between the standard of arm blood pressure meter and the wrist gauge. Our pearson correlation is .0725 which makes senses showing very little relationship between the bicep gauge and the wrist gauge.
Summary/DiscussionAll in all, the pulse test was the only one to be found as a valid device since our T-test value was so high. The Omcron device was tested to be statistically significant to test for pulse but not blood pressure. This makes senses since the pulse is tested by hand in the wrist on occasion. The wrist is too far from the heart and is difficult to test for blood pressure because of this reason. The bicep cuff is a more valid way of testing blood pressure since the bicep has a stronger flow of blood. The Raiin device was also found to be invalid since it is both difficult to get a reading from the armpit area and it is difficult to get to connect to bluetooth and our group personally had difficulty making a connection between the iPhone and Raiin device. Our T-test and Pearson correlation were so low it backed this finding. If we were able to get more accurate readings from the Raiin device it might have been found to be a valid device but since the data from the entire class showed very little similarties, we thought even if we did have a good connection, we would have gotten data similar to the rest of the class. Possible error includes not close enough connection to the skin with the Omcron and Raiin devices and not being able to get readings from the Raiin device everytime. Also we might not have gotten enough variability in our tests with all of the devices.
LAB 3B WRITE-UPTarget Population and NeedWe are targeting athletes and people who would like to increase their physical acuity by accurately monitoring caloric intake. This device will help people in need of consistent and personalized nutritional or dietary information. Moreover, it will provide faster quantitative readings for kCal, sugar, and fat than current blood tests require.
Device DesignInferential Statistics
Graph
|
||||||

