BME100 s2014:W Group11 L3
| Home People Lab Write-Up 1 | Lab Write-Up 2 | Lab Write-Up 3 Lab Write-Up 4 | Lab Write-Up 5 | Lab Write-Up 6 Course Logistics For Instructors Photos Wiki Editing Help | ||||||
OUR TEAM
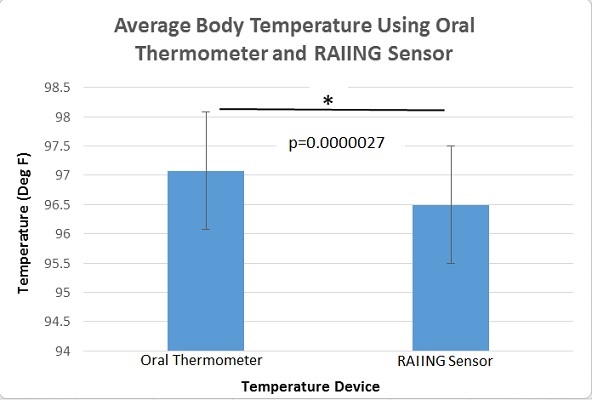
LAB 3A WRITE-UPDescriptive StatisticsThe mean temperature taken with the gold standard thermometer was 97.078 degrees F. The mean temperature taken with the RAIING temperature sensor was 96.495 degrees F. The standard deviation for the gold standard oral thermometer temperature readings was 1.075 degrees F. The standard deviation for the RAIING temperature sensor readings was 2.028 degrees F. The standard error for the oral thermometer was 0.063 degrees F. The standard error for the RAIING device was 0.118 degrees F.
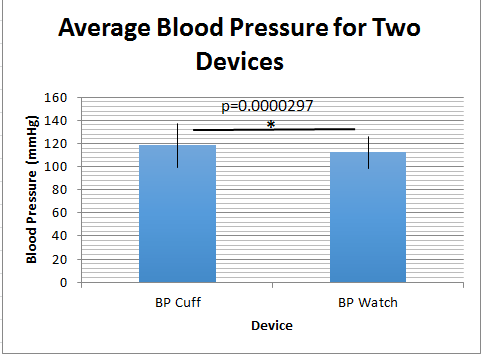
The standard deviation for the gold standard blood pressure cuff readings was 18.954 mmHg. The standard deviation for the Omron watch blood pressure readings was 13.537 mmHg. The standard error for the blood pressure cuff was 1.229 mmHg. The standard error for the Omron watch was 0.877 mmHg.
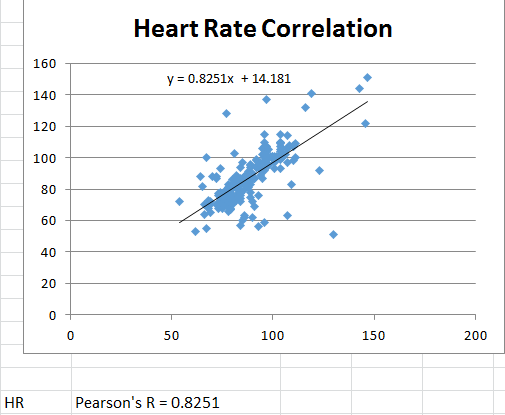
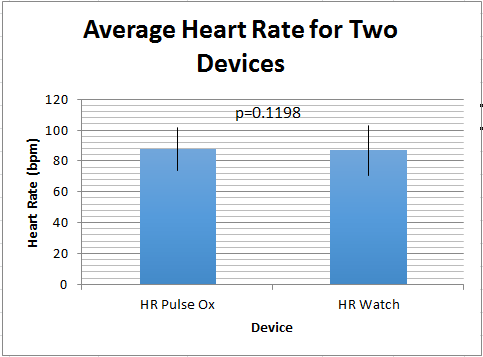
The standard deviation for the gold standard pulse oximeter heart rate readings was 13.946 bpm. The standard deviation for the Omron watch heart rate readings was 16.205 bpm. The standard error for the pulse oximeter heart rate readings was 0.904 bpm. The standard error for the Omron watch heart rate readings was 1.050 bpm.
Results
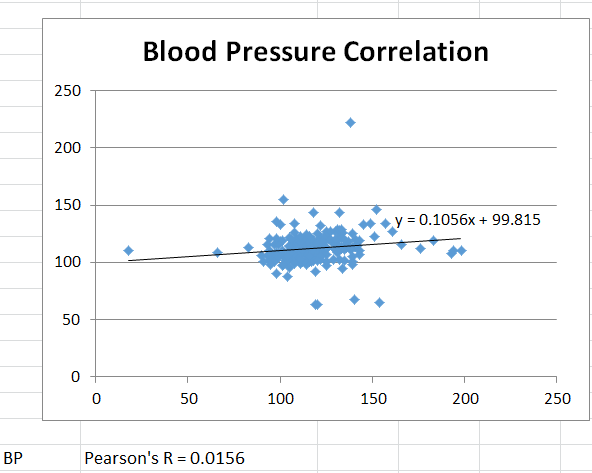
AnalysisFor each of the quantities measured (diastolic blood pressure, heart rate, and body temperature) a separate t-test was used to compare the results between the experimental devices and the gold standards (2 sources of data). It was a paired t-test because the devices were tested on individuals simultaneously as opposed to having different groups testing each device alone. T-Tests: In analyzing the results of the temperature devices' t-test, the p value was calculated to be 2.7*10^-6. This value is much less than 0.05 indicating the results are statistically significant. The data from the blood pressure devices resulted in a p value of 2.97*10^-5, which also confirms statistical significance. However, the p value for the heart rate devices was calculated to be 0.1198, which is larger than 0.05 and indicates results that are not statistically significant. Pearson's R: The Pearson's R of the blood pressure devices resulted in R = 0.1056 which is almost no correlation whatsoever. The Pearson's R of the heart rate devices, on the other hand, was calculated to be R = 0.8251 which indicates a relative amount of correlation but not extremely high.
Summary/DiscussionTemperature Devices: After testing the two different thermometers, it was easy to find design flaws in both the oral thermometer and the RAIIN sensor combined with the Iphone application. While performing the tests on the oral thermometer for example, it was found that stepping outside to the cooler weather changed the body temperature found by the oral thermometer. This is probably due to the fact that the tip of the thermometer responsible for sensing temperature was exposed to the cooler weather before being put into the mouth and did not have enough time to adjust to the body temperature in the amount it takes to record a reading. An engineer could design a thermometer that knew when it was exposed to an enviornment that was not room temperature and adjust accordingly to fix this flaw. Putting a simple cover on the tip that isolated it from the outside enviornment until it was placed in the mouth could've also helped improve the flaw. The RAIIN sensor that was placed in the underarm of the test subject had plenty of design flaws as well. To start, the Iphone app that was conected to the sensor had a very short range, as in the subject could not move very far from the phone without losing the connection. Having a sensor that was able to show the results on its own screen would've helped fix this problem, so patients that do not have a phone with application abilities or bluetooth could still use this particular thermometer. Secondly, the sensor had a hard time staying in place when the subject was not sitting down and staying in place. To test the RAIIN sensor properally, it had to be taped around the body, under the arm. Perhaps designing a sensor with a armband or easily adjustable strap wouldve helped the sensor stay in proper place, thus improving the results. Finally, the sensor, like the oral thermometer, was sensivitive to the outside enviornment, and would have different results when the subject stepped outside versus staying indoors. Simular solutions like having a sensor that knows when it has been exposed to an enviornment other than room temperature, and special enclosures would've helped with this design flaw. Blood Pressure Devices: The two blood pressure devices, the cuff and the watch, both had their share of design flaws but not as many as the thermometers. Beginning with the cuff, it's major flaw was the device would periodically result in an "Error" at the end of testing. It was not clear whether it was human error or some computational error in the device itself because no other information was given. Additionally, the human error that is possible is another design flaw of the device because it is easy to mess up the procedure by not inflating enough, inflating too much, releasing too slow or too fast, etc. Lastly, the device requires the patient to be seated and holding their arm out on a table which eliminates recording the blood pressure of the patient during exercise or activities. The watch also had design flaws. First, there were a couple times the watch would inflate beyond 200 mmHg, which is unnecessary and painful. It may be due to the watch being put on improperly or perhaps the differences in people's wrist area. Additionally, the device requires the patient to hold their arm up to their chest as they are sitting and, again, eliminate the possibility of recording blood pressure during exercise or activities. Heart Rate Devices: The heart rate as taken from the pulse oximeter worked very well. It's only design flaw is that it is not suitable for measuring heart rate while exercising or doing activities because it would fall off of the patient's finger. The heart rate as taken from the watch has the same flaw because it is necessary to hold your arm up to the chest and be seated. Also, it is possible that since the heart rate must taken simultaneously with blood pressure, there could be some effect on the heart rate. This is only of note because the pulse oximeter does not have this requirement.
LAB 3B WRITE-UPTarget Population and NeedThe Smart Blanket set consists of an electric blanket, a core body temperature sensor, and a cell phone app. Before the Smart Blanket user goes to sleep for the night, she/he applies the temperature sensor to her/his sternum using the specially designed comfort band. The blanket receives feedback from the sensor every fifteen minutes during the night and changes temperature based on the user's changes in body temperature. When the user's core body temperature decreases, the electric blanket heats up. When the user's core body temperature increase, the electric blanket produces less heat or turns off. The blanket is made from a porous material that allows for air flow, which keeps overheating due to the mere presence of the blanket from being much of an issue. The cell phone app keeps track of body temperature readings and displays the data for the user, including high and low body temperatures for the night as well as variability in temperature. The padded sensor and felxible, breathable band allow for accurate temperature readings throughout the night without infringing on comfort. The temperature sensor is similar to one that might be marketed to athletes, such as the RAIING temperature sensor. However, the Smart Blanket sensor allows for much more accurate readings considering that evaporative cooling is not a factor when a person is under a blanket, and the sensor is placed on the sternum area. Without evaporative cooling as a factor, the skin will not be cooled at a much faster rate than the core, which is an issue during exercise with sensors that monitor temperature from the skin. During other scientific experiments, the sternum has been shown to give a more accurate representation of core body temperature than other external body locations. Due to the more accurate measures of core body temperature, the Smart Blanket is able to accurately detect whether the user would be more comfortable with a warmer or cooler blanket. The target audience of the Smart Blanket includes people who are disabled and/or elderly. People who have difficulties with moving their limbs can find the repositioning/removal of blankets to be an extreme hassle. People with conditions such as cerebral palsy may be unable to remove excess blankets or retrieve more, which can cause suffering from overheating or underheating during the night. Usually, a caretaker would have to be called in to remedy such issues. However, these issues disappear with the Smart Blanket. Only one blanket is need be applied, which prevents overheating, especially with the porous material and air flow. Effective heating is not sacrificed for these precautions as the blanket's electric framework produces a comfortably toasty interior when needed. The automatic feedback system between the blanket and the sensor components of the Smart Blanket device creates the ideal temperature environment without need of manual adjustment. The infirm --and their caretakers-- can rest easily. The Smart Blanket device would be especially effective in hospitals or nursing homes. Patients' sleep comfort needs are met without the expenditure of time and energy by the already-busy staff.
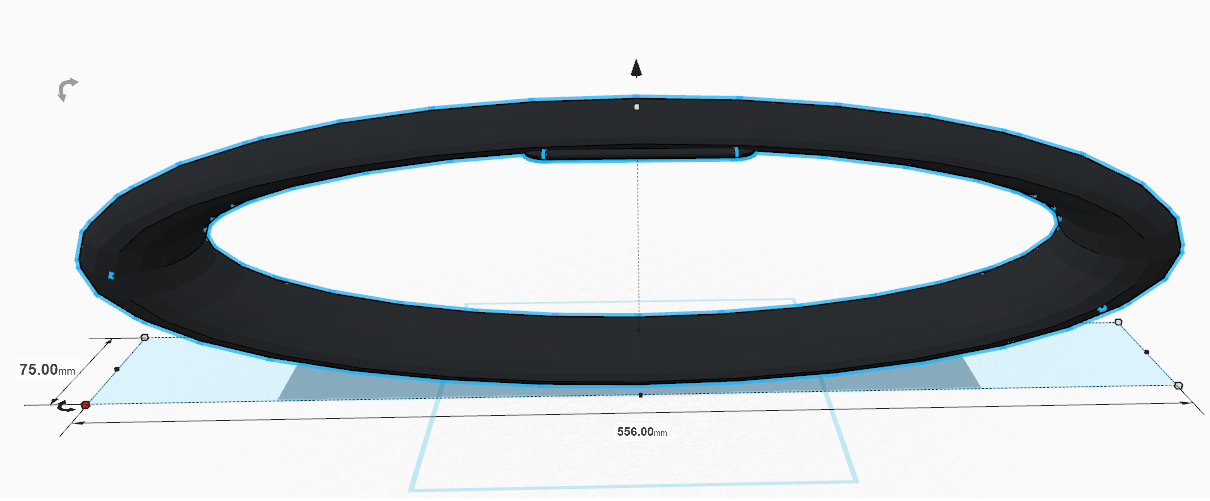
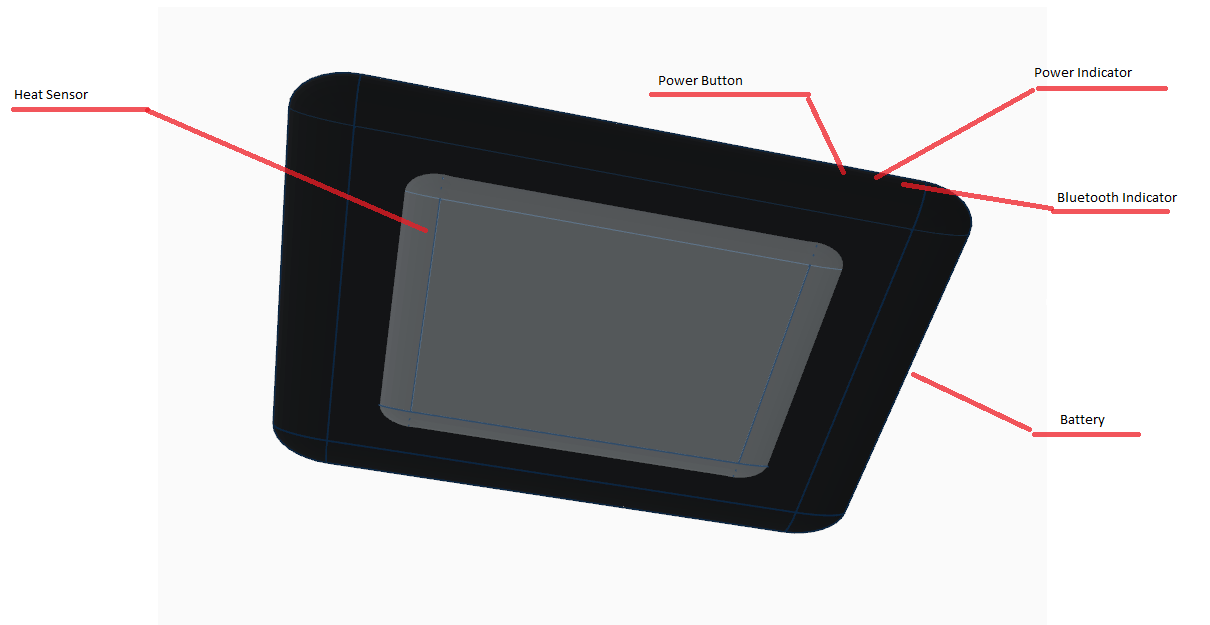
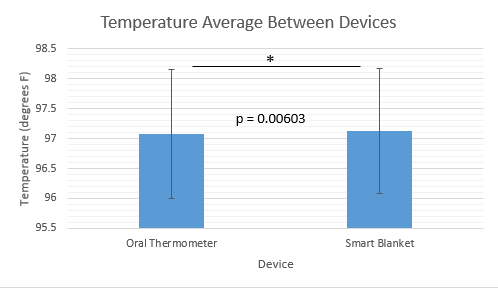
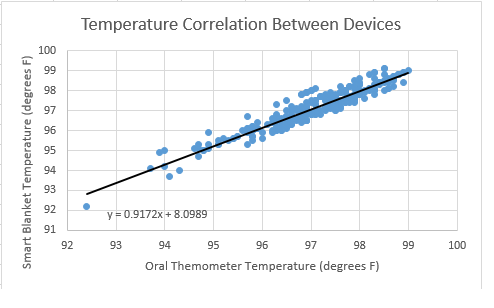
Device DesignBottom View of Band with Sensor attached Measurements of Band and Sensor (Band is elastic) Inferential StatisticsThe t-test run on the Smart Blanket temperature data and the gold standard oral thermometer data resulted in a p value of 0.00603, indicating statistical significance. The Pearson's R for the data was 0.917, showing a positive correlation between the data sets.
Graph
Results showed that the Smart Blanket temperature data and the oral thermometer temperature data were statistically significant.
|
||||||

