BME100 s2014:T Group4 L5
| Home People Lab Write-Up 1 | Lab Write-Up 2 | Lab Write-Up 3 Lab Write-Up 4 | Lab Write-Up 5 | Lab Write-Up 6 Course Logistics For Instructors Photos Wiki Editing Help | ||||||||||||||||||||||||||
|
OUR TEAM
LAB 5 WRITE-UPBackground InformationSYBR Green Dye A photosenstive dye that reacts with certain DNA strands.
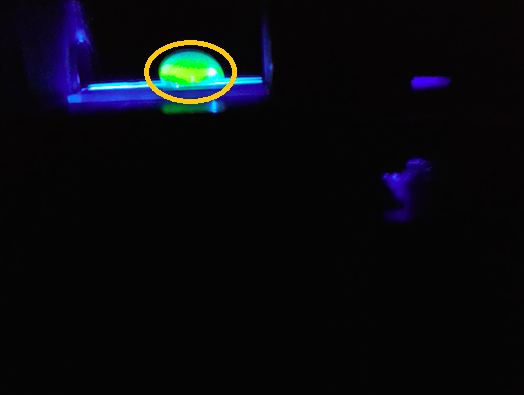
The dye helps quantify how much DNA is present and therefore a sample with more DNA will appear more green.
SYBR green stains the DNA strands in order to show how much DNA is in a sample when a beam of light is shot through the sample.
SYBR green in high concentration is used in PCR similar to the lab performed. This helps us find out how much DNA is in a certain sample.
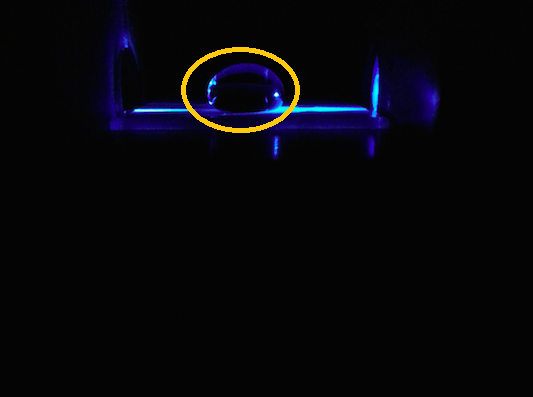
When there is little to no DNA in the sample the dye will not stain as much and by consequence the sample will not shine with a green glow when light is shot through it.
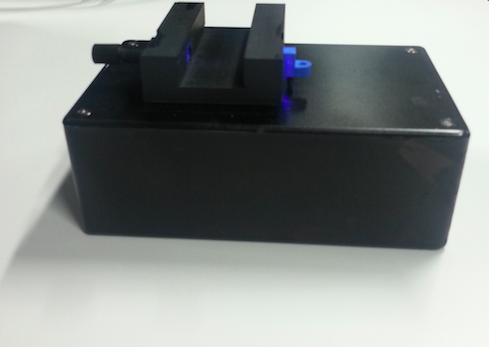
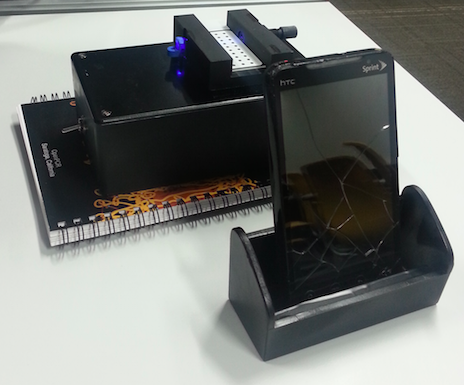
The SYBR green dye works best with double stranded DNA however, it has been shown to stain single stranded DNA and in some cases even RNA. This single drop fluorimeter is a box that covers a black stand that can hold a bubble of solution.
ProcedureSmart Phone Camera Settings
Solutions Used for Calibration
2. Placed 80 microliters of SYBR Green in between the two middle circles of the slide.
7. Wait five seconds for the camera timer to expire, and then take the sample out and save the picture for analysis.
Data AnalysisRepresentative Images of Samples Negative Control Positive Control
{| |
||||||||||||||||||||||||||
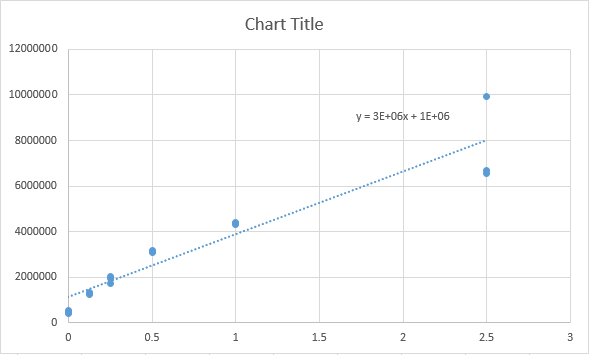
| Final DNA Concentration | RAWINTDEN of drop | RAWINTDEN of background | RAWINTDEN drop - RAWINTDEN background | |||||||||||||||||||||||
| 2.5 | 10001162 | 72782 | 9928380 | |||||||||||||||||||||||
| 2.5 | 6726675 | 40465 | 6686210 | |||||||||||||||||||||||
| 2.5 | 6571887 | 40455 | 6531432 | |||||||||||||||||||||||
| 1 | 4366858 | 38133 | 4328725 | |||||||||||||||||||||||
| 1 | 4393627 | 37731 | 4355896 | |||||||||||||||||||||||
| 1 | 4416778 | 37069 | 4379709 | |||||||||||||||||||||||
| 0.5 | 3171170 | 40433 | 3130737 | |||||||||||||||||||||||
| 0.5 | 3187197 | 39794 | 3147403 | |||||||||||||||||||||||
| 0.5 | 3113140 | 43137 | 3070003 | |||||||||||||||||||||||
| 0.25 | 1751859 | 37579 | 1714280 | |||||||||||||||||||||||
| 0.25 | 2062352 | 43553 | 2018799 | |||||||||||||||||||||||
| 0.25 | 1979956 | 42452 | 1937504 | |||||||||||||||||||||||
| 0.125 | 1315149 | 38227 | 1276922 | |||||||||||||||||||||||
| 0.125 | 1271349 | 40257 | 1231092 | |||||||||||||||||||||||
| 0.125 | 1355536 | 43030 | 1312506 | |||||||||||||||||||||||
| 0 | 478359 | 40699 | 437660 | |||||||||||||||||||||||
| 0 | 557450 | 39977 | 517473 | |||||||||||||||||||||||
| 0 | 448736 | 43522 | 405214 | |||||||||||||||||||||||
Fitting a Straight Line
PCR Results Summary
Instructor's summary: You completed 8 PCR reactions in a previous lab. You used the SYBR Green I staining and imaging technique to measure the amount of amplified DNA in each PCR reaction. You used a standard curve (based on known concentrations of calf thymus DNA) to convert INTDEN values into DNA concentration. Your positive control and negative control samples should be used as threshold values for determining whether an unknown (patient) sample is truly positive or negative.
Your positive control PCR result was 0.241 μg/mL
Your negative control PCR result was -0.00028 μg/mL
Write-in each patient ID and give both a qualitative (what the images looked like) and a quantitative description (μg/mL) of what you observed
Patient 31526 : Sample was nonreactive with SYBR Green 1 and showed no green coloration under fluorescent light
Patient 36055 : Sample was nonreactive with SYBR Green 1 and showed no green coloration under fluorescent light
Compare each patient's results to the positive control value and the negative control value. Draw a final conclusion for each patient (positive or negative) and explain why you made that conclusion.
Patient 31526 : This patient was negative. The corrected PCR Product Concentration strongly resembled the negative control value
Patient 36055 : This patient was negative. The orrected PCR Product Concentration had a value much closer to the negative control than the positive.
|}
