BME100 s2014:T Group4 L3
| Home People Lab Write-Up 1 | Lab Write-Up 2 | Lab Write-Up 3 Lab Write-Up 4 | Lab Write-Up 5 | Lab Write-Up 6 Course Logistics For Instructors Photos Wiki Editing Help | ||||||
OUR TEAM
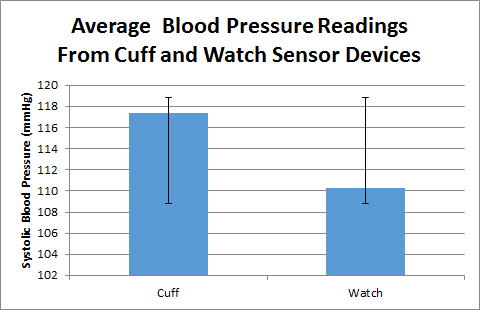
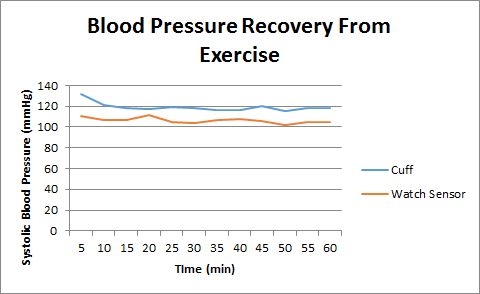
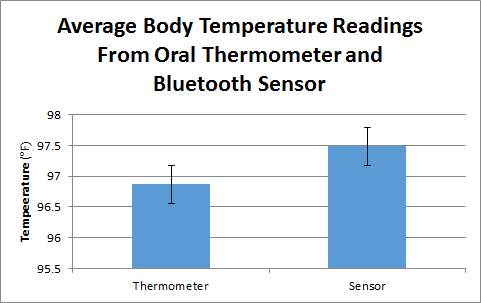
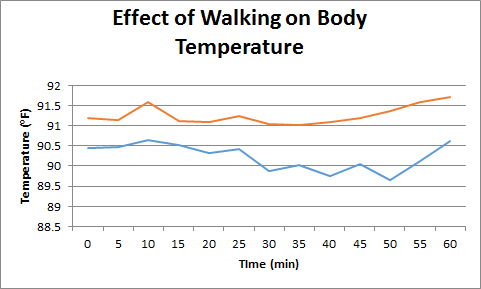
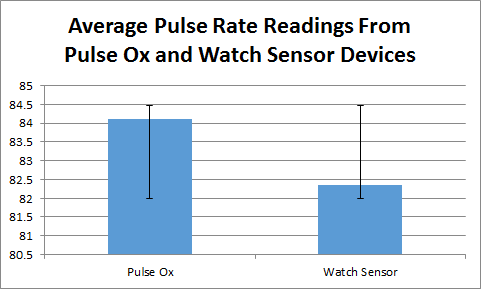
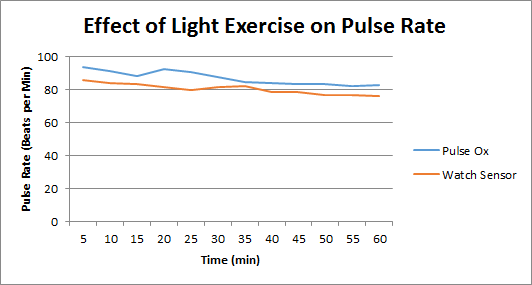
LAB 3A WRITE-UPDescriptive StatisticsBlood Pressure: The mean systolic blood pressure from the watch sensor was 110.29 mmHg. The T-test between the blood pressure cuff and the watch sensor calculated a p-value of 0.068. We can conclude that the watch sensor is not to a comparable standard of the blood pressure cuff which is used around the world. This was also supported with an R-value of 0.44, which represents poor correlation between the two devices. Temperature: The mean body temperature for the Bluetooth sensor was 97.48 degrees Fahrenheit. The T-test between the oral thermometer and Bluetooth sensor calculated a p-value of 0.17. From this, we can conclude that the Bluetooth sensor is not a satisfactory replacement for the gold standard oral thermometer. This is supported by the R-value of 0.36, which is a poor correlation for the two devices. Pulse: The mean pulse for the watch sensor was 82.36 beats per minute. The T-test between the pulse oximeter and the watch sensor calculated a p-value of 0.26. We can conclude that the watch sensor is not a satisfactory replacement for pulse oximeter gold standard. The R-value however, is 0.89 which is a fairly strong positive correlation.
Results
AnalysisFor our group a paired t-test was used. We chose the paired t-test because the subject was the same subject was used for the tests. The subject was just measured under different conditions. This is why the paired t-test should be chosen. Also, the t-test is most useful in the comparison of only two groups with a single variable. The ANOVA test is a good test to use in a large scale multi-group comparison. The ANOVA can show that there is significant data somewhere, but is not necessarily as precise as the t-test. The ANOVA was not needed for this experiment because in each category, only two devices were being compared and only one variable was being manipulated. The Pearson's R test was used when comparing the experimental device to the gold standard device. This was used for all three categories: blood pressure, body temperature, and pulse. The reason for this test was to correlate how accurately the data from the experimental device compared to the data from the "ideal" device used by professionals.
Summary/DiscussionThe lab showed that when measuring blood pressure or temperature the device you choose to use can be more ideal in certain situations. A flaw in the design for the temperature taking app with Bluetooth connection was that the signal was very weak. The phone would disconnect from the device constantly and effected the data in some cases. This device could be improved if there was a wire that plugged into the phone. This would ensure the connection would stay strong. A flaw in the blood pressure was that it would show large scale blood pressure changes even in a state of rest. To improve on the blood pressure readings we should have taken the tests when at rest in shorter increments. Also, not removing the device from the wrist could help. This would make the blood pressure reading become more consistent. When going outside the subject had to come back inside to take their blood pressure. If we were to take their blood pressure outside similar to the way we did with the temperature this could have led to more accurate results.
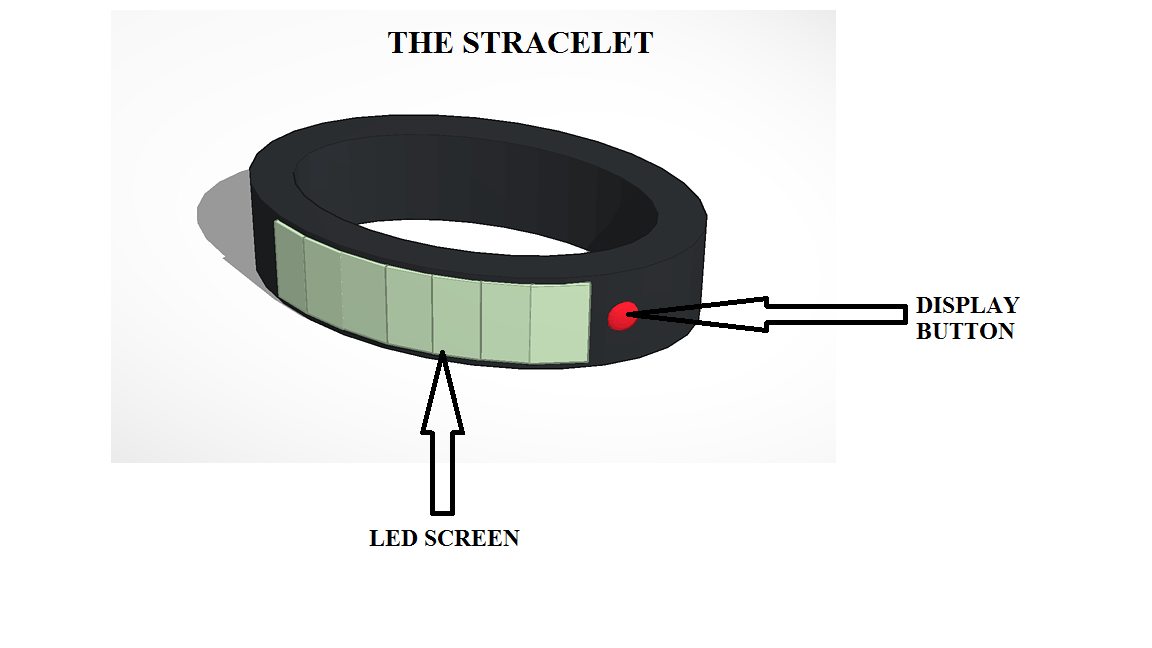
LAB 3B WRITE-UPThe Stracelet! Target Population and NeedThe target population is people that are 18 years or older and pre-retirment. With a focus in college students, and business people. People in this population are widely regarded as having the most stressful lives. This stracelet is designed to read stress levels through how much cortisol is in the body, and then release a hormone to counteract the coritsol. This will relieve stress in people. People are becoming progressively less health, and tired of being so stressed. This bracelt is in dire need for the population. People being able to relive stress in an instant will improve health and happiness levels. People under less stress will also, be able to function and work better in situations where stress is not an issue.
Device Design
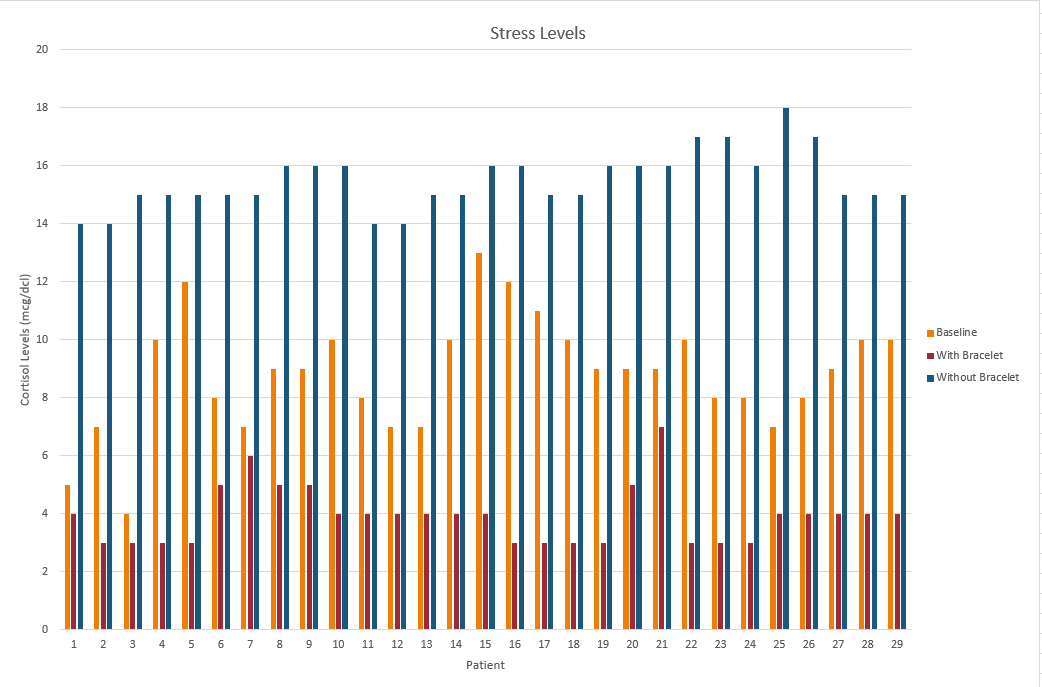
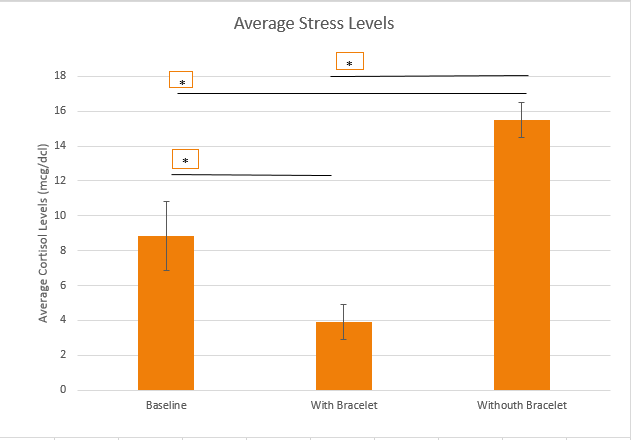
Inferential StatisticsAverage Stress Levels (mcg/dcl):
Graph
|
||||||

