BME100 s2014:T Group14 L3
| Home People Lab Write-Up 1 | Lab Write-Up 2 | Lab Write-Up 3 Lab Write-Up 4 | Lab Write-Up 5 | Lab Write-Up 6 Course Logistics For Instructors Photos Wiki Editing Help | ||||||
OUR TEAM
LAB 3A WRITE-UPDescriptive StatisticsTemperature Oral Mean: 96.60 Standard Deviation: 1.771 Standard Error: .1003
Sensor Mean: 97.50 Standard Deviation: 1.254 Standard Error: .0697
Heart Rate and Blood Pressure Heart Rate Watch Sensor Mean: 83.44 Standard Deviation: 16.4002 Standard Error: .9962
Pulse Oximeter Mean: 85.62 Standard Deviation: 17.817 Standard Error: 1.0822
Blood Pressure Gold Standard Blood Pressure Cuff Mean: 120.166 Standard Deviation: 17.764 Standard Error: 1.079
Watch Sensor Mean: 113.572 Standard Deviation: 13.6078 Standard Error: .8266
Results
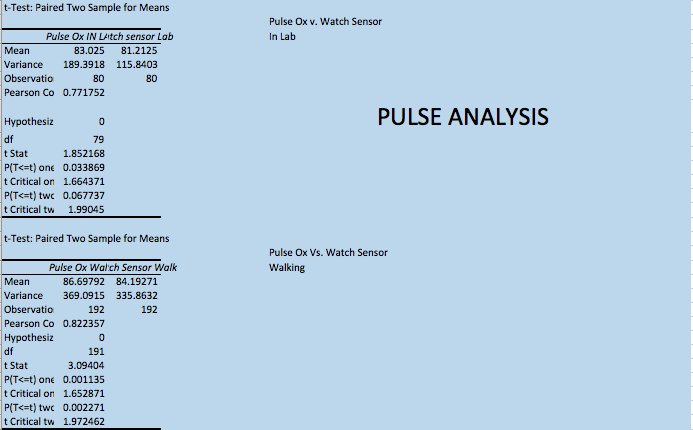
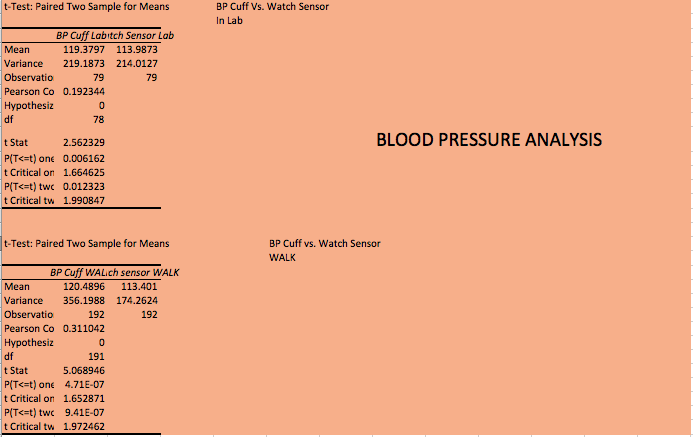
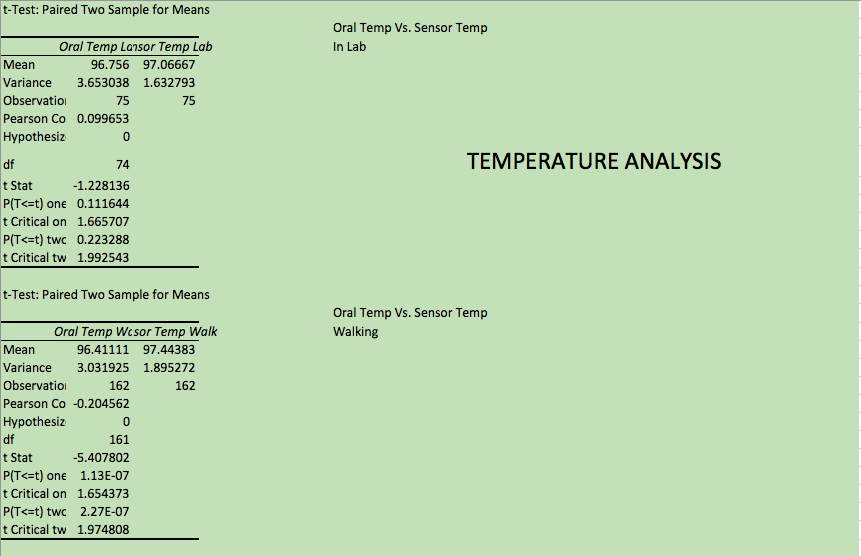
AnalysisThe t-test values between two data sets was used to compare the statical correlation significance between them. For this purpose a paired t-test used. The p-values that were generated from this data demonstrates weather or not there was extreme data points in the measurement set. The closer the p-value is to 0.05 shows that the closer the data is to being reliable to each other. For the blood pressure measurements that were taken with the cuff and watch sensor, the p-value= 9.41E-7. This indicates that the data between the two sets is not reliable and that the measurements exhibited extreme behaviors. For the measurements of temperature, the p-value= 1.06E-6, also indicating non-reliablitiy. A Pearson's R value was calculated for the measurements of pulse using the pulse oximeter and the watch sensor. Two sets of measurement were taken, one inside the lab and one outside; the values are R= 0.771 and R= 0.822 respectively. For measuring blood Pressure, a cuff and watch sensor were implemented using two variables of measurement. One for sitting in lab and the other while walking outside. The values were: walking outside R= 0.311 and in Lab R=0.192. To measure temperature, two devices, the oral monitor and temperature sensor were used and measurements were taken in Lab, walking around outside and then back in Lab again. These R values were R=0.0997 (in Lab), R=-0.205 (walking outside), and R=0.187 (back in Lab after walking). In order for there to be significant correlation between data sets, the R values must be close to either 1 or -1. If the value is close to 1, there there is a significant positive correlation. If the value is close to -1, then the correlation is significantly negative. For all of the measurements of blood pressure and temperature, the R values were not close to 1 or -1 which dictates that there is very little linearization between the two data sets. The sets of data for pulse are closer to 1 indicating that there is more linearization between the two sets of measurements. Summary/Discussion
When testing the RAIIN sensor combined with the iPhone app while simultaneously testing the oral thermometer on the same subject, we found that the devices were producing different results, leading us to believe the devices are inaccurate under certain conditions. For example, the temperature measured by the RAIIN sensor may differ depending on how well the device is secured, as it was easy for it to slip out of the correct position. The RAIIN sensor’s readings also depend on the environment and conditions. The heavy jacket our subject was wearing paired with the outside heat caused the sensor to read that our subject had a body temperature over 104 degrees Fahrenheit, which is significantly higher than the sensor’s results produced when the subject was inside. Along with that, the vitals application on the iPhone connected to the sensor had a very short range, preventing the subject from moving a short distance away from the phone. We recommend that the sensor be designed to be less sensitive to its environment and either be able to connect at a longer range, or find a substitute to the iPhone app. The oral thermometer provided a consistent and accurate reading on the subject’s body temperature. However, we were a bit confused on when the thermometer was done reading the temperature because it displayed different temperatures and took a while to beep. To avoid this confusion, we recommend that the device either is more expedient to read the temperature and beep or that it only displays the temperature when it is done reading.
When measuring blood pressure we used the cuff and the watch sensor. Omron Watch Sensor - This device measured pulse, systolic and diastolic blood pressure. The user had to hold the arm with the watch on it at heart level. Some possible flaws in the device are inconsistency with radial artery from patient to patient. Meaning one patients radial pulse and pressure could be more prominent or less prominent than that of another patient, causing the device to measure improperly. There is not really a way to fix this problem within the threshold of the device since it is an issue with the patients radial artery. Blood Pressure Cuff: The blood pressure cuff was accurate and consistent. The BPC was vulnerable to human error by possible wrongful placement on the arm. This can only be avoided by taking more readings and eliminating extreme outliers.
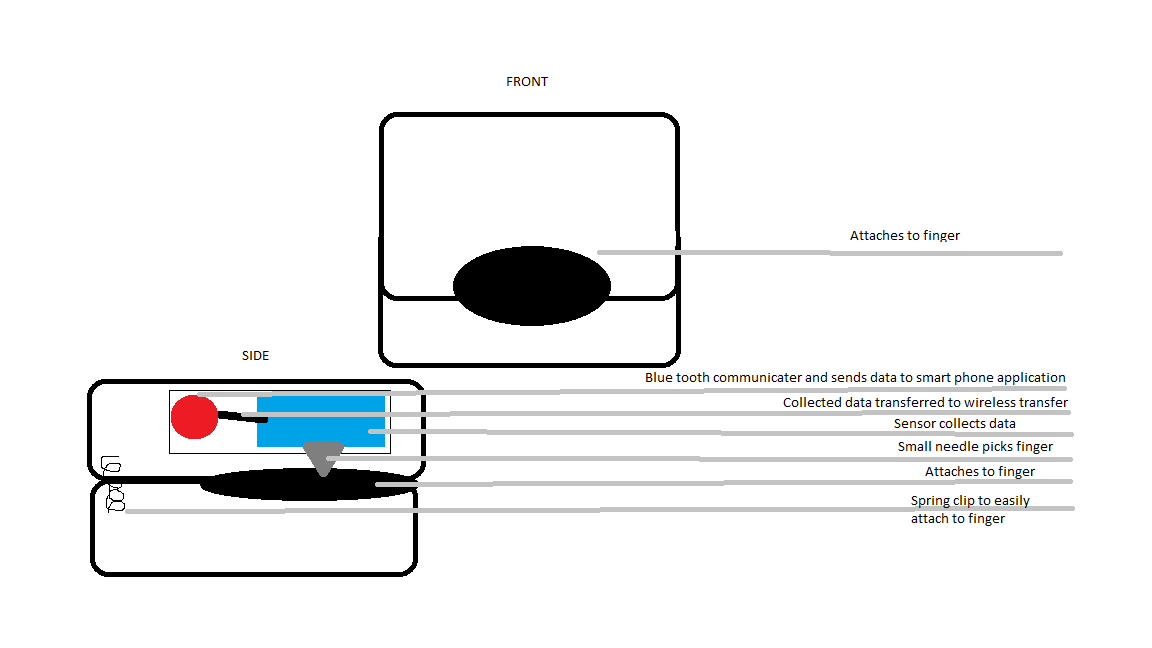
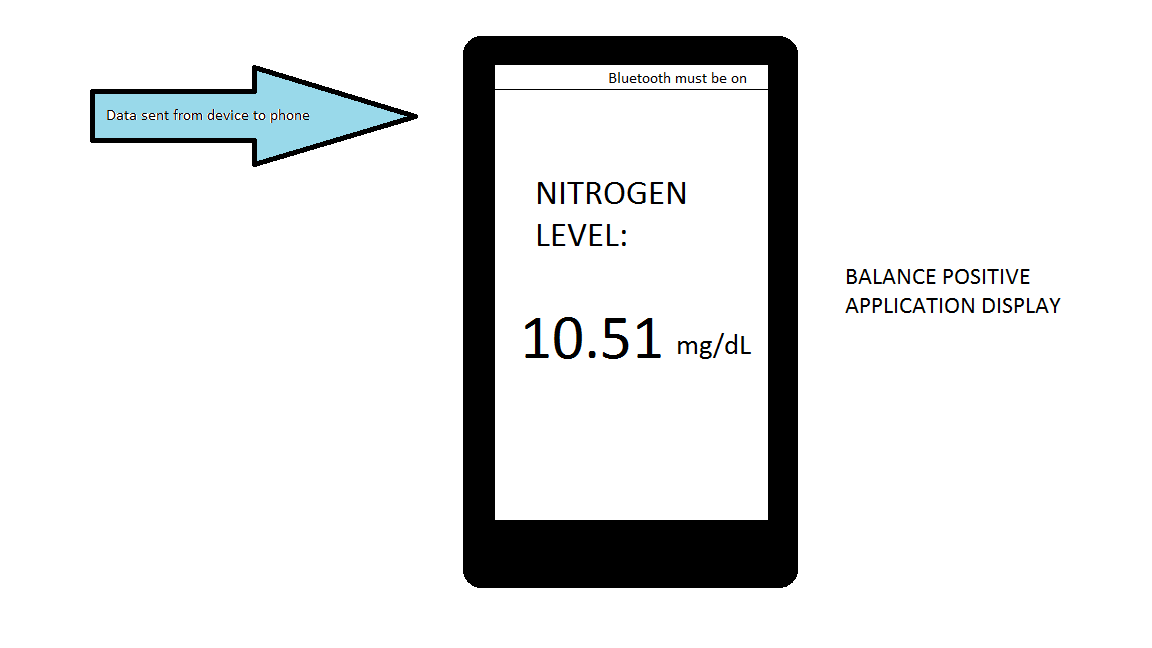
The pulse oximeter used to measure the heart rate of our subject was consistent and accurate. However, the clip on the finger did not grip very well, making it easy for it to slide off the subject’s finger. This can be fixed by simply making the clamp tighter or adding grippier material. LAB 3B WRITE-UPTarget Population and NeedOur target population seems to be mostly athletes and people interested in gaining muscle mass and/or burning fat. This could also be useful in aiding people of all body types in order to lose weight and develop a healthy lifestyle around a positive nitrogen balance. This also can help in the observation of kidney disease as recommended by a doctor for more monitoring to prevent kidney failure. This device is needed for personal application, without having to go to a doctor to draw blood, mainly to aid personal convenience. The Balance Plus device is small and easy to use. Like a glucose monitor for diabetics, this device clips onto the finger (similar to a pulse oximeter). It draws a small amount a blood, the same as a pin prick of blood and measures the urea nitrogen levels. The results are then sent wirelessly and into the bluetooth application on your cell phone (which is applicable through any device). This device is meant to be a better alternative to the BUN test. Our device is less invasive and and meant to be more comfortable than the traditional BUN test, as well as giving relatively instant results instead of having a BUN blood test run in a lab that could take up to two weeks.
Device Design
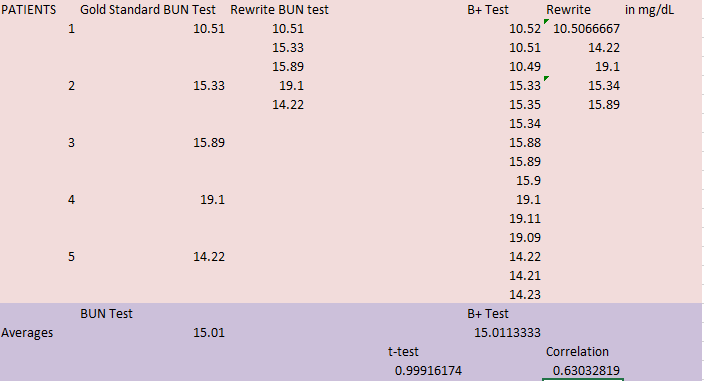
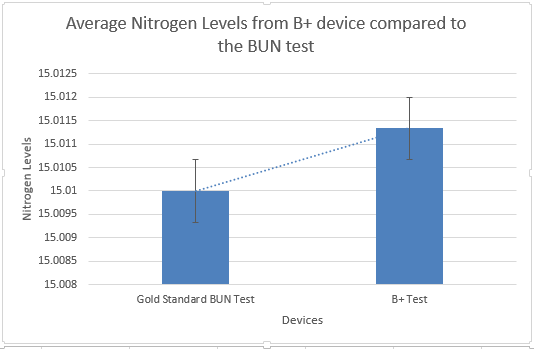
Inferential StatisticsTest: Using 5 healthy patients, we will test the accuracy and validity of our Balance Plus device that tests urea nitrogen level in the blood compared to the gold standard BUN (Blood Urea Nitrogen) test performed in a lab. There is one test performed for the BUN test. While the blood is sent to the lab for testing, the Balance Plus test will be performed three times during this period. We will then compare the results of our 5 patients for validity or our Balance Plus.
Graph
|
||||||


