BME100 s2014:T Group11 L3
| Home People Lab Write-Up 1 | Lab Write-Up 2 | Lab Write-Up 3 Lab Write-Up 4 | Lab Write-Up 5 | Lab Write-Up 6 Course Logistics For Instructors Photos Wiki Editing Help | ||||||||||||||||||||||||||||||||||||||||||||||||||||||
OUR TEAM
LAB 3A WRITE-UPDescriptive & Inferential StatisticsTemperature Data:
Blood Pressure Data:
Pulse Data:
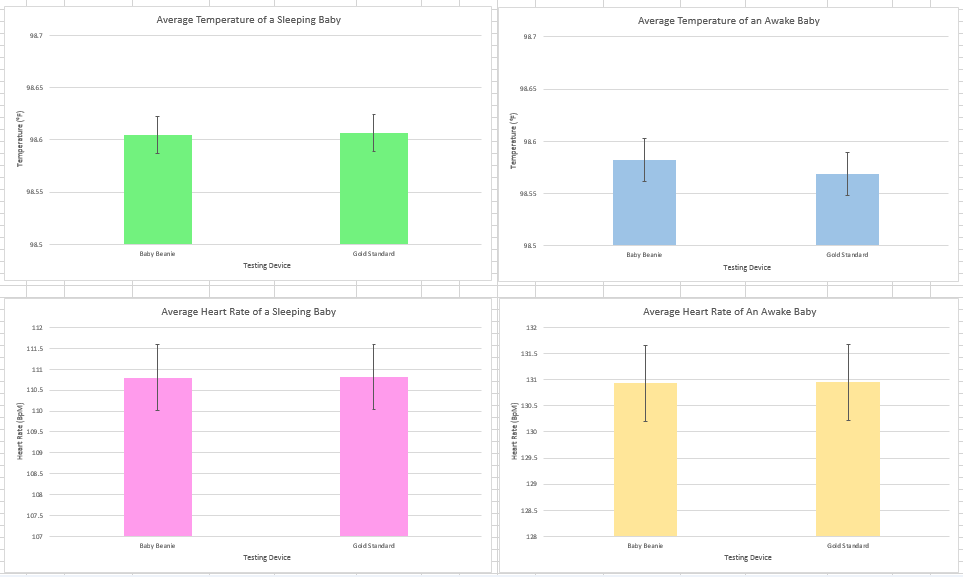
In each experiment, an experimental diagnostic device was used alongside a proven device as a standard. Because there was only two data sets in each trial, a t-test was performed to determine a significant difference. In each trial, the t-test showed a significant difference between the data sets. In this case, it shows that the experimental devices did not produce reliable results when compared to the proven standards. Graphshttps://www.dropbox.com/s/eiyadkmcrvd78ui/Lab%203A.xlsx
Summary
The Watch Sensor was used to measure both the blood pressure and the heart rate. However, this method of testing had a few problems associated with it. On one hand the watch sensor is more convenient than the blood pressure cuff as it doesn’t require such a large apparatus and it can be worn like a watch. Unfortunately, a few problems we noticed arose when we used the device for its intended purpose; namely the watch sensor would slide down the arm when air was being released from the device this could lead to a higher blood pressure reading. A solution to this problem would be to implement a new testing position for the device, such as laying the arm on a flat surface during measurement.
LAB 3B WRITE-UPTarget Population and NeedThe Baby Beanie is aimed specially at the new, worried, protective parents of newborns and infants. More generally it is aimed at all the parents of newborns and infants. A secondary target population are those individuals that are responsible for watching babies like babysitters and different daycare professionals. As a device the Baby Beanie will provide constant monitoring of a baby’s vitals like temperature, pulse and sound monitoring. As a product the Baby Beanie combines three generally separate devices as well as providing a constant monitoring that is not present in current baby vital measurement products. The Baby Beanie will provide a monitoring device for parents that is applicable for both daytime and nighttime monitoring.
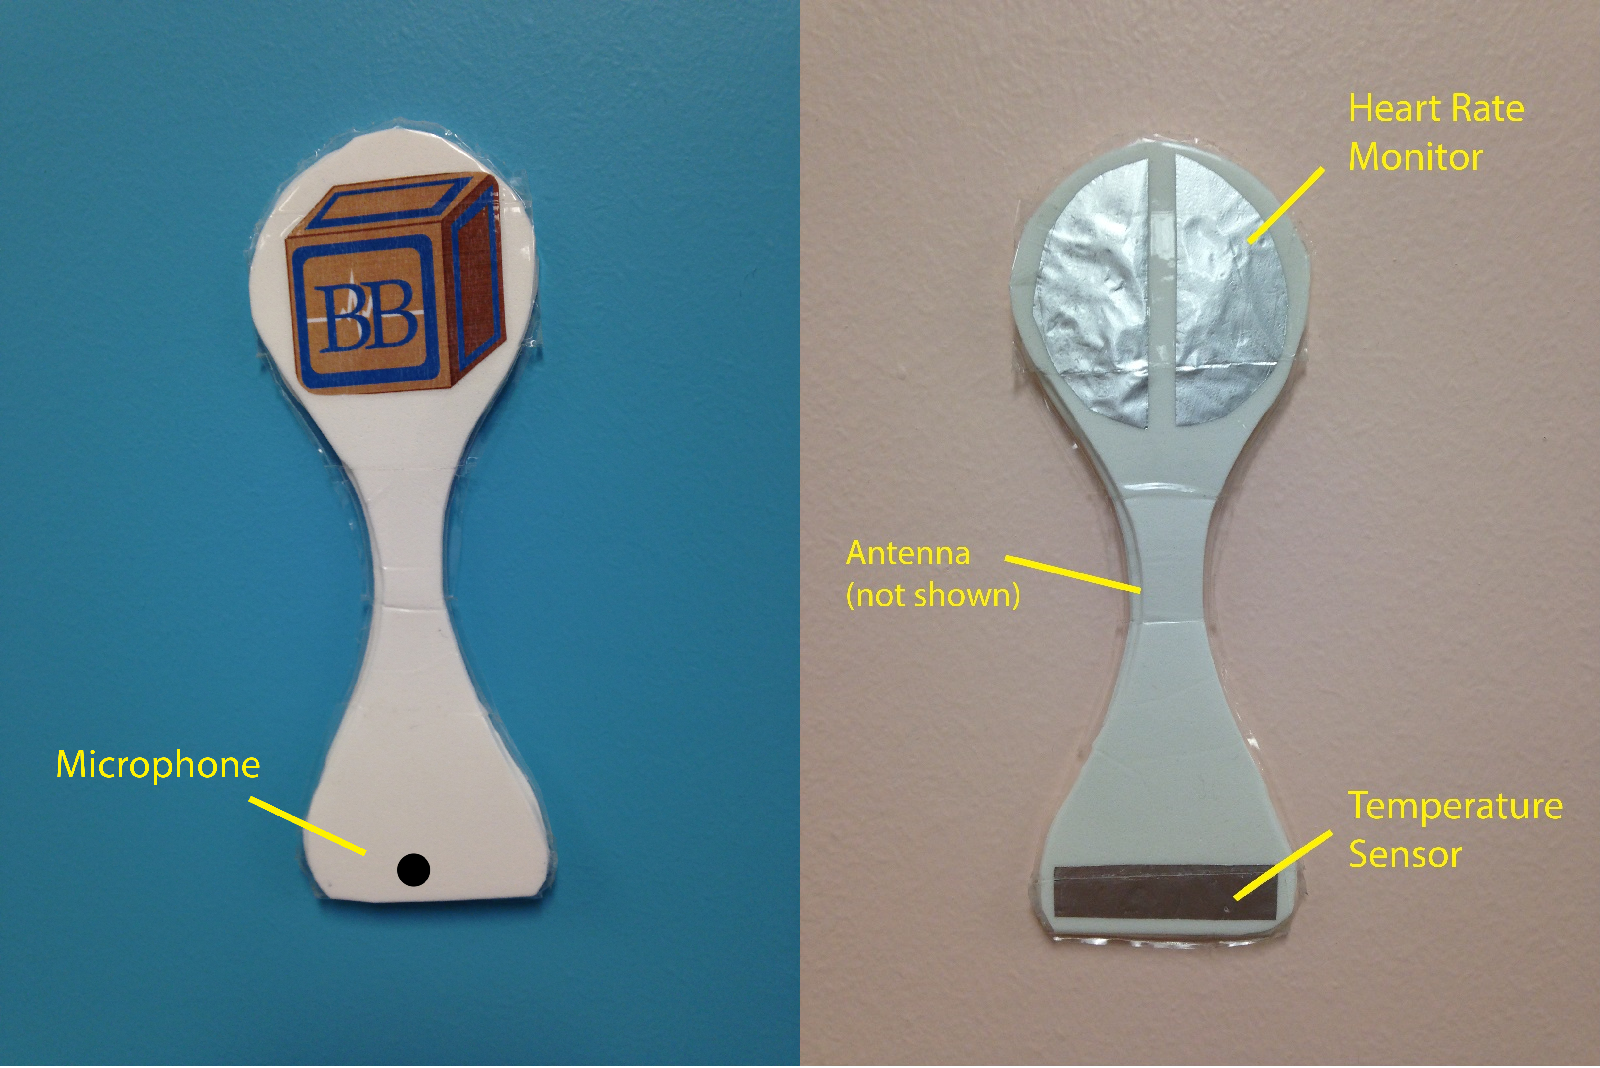
Device DesignThe Baby Beanie consists of two parts. The first part is the actual measuring and monitoring portion of the Baby Beanie. It consists of a flexible fabric with three electrode sensors. The top two sensors are used to measure the baby’s pulse and sensor located at the bottom measures the baby’s temperature. This can be seen in Image 1. On the bottom of the top side of the device is where the microphone is located, as seen in Image 1. Throughout the middle of the device is the Bluetooth transmitting hardware as well as the processing chips that compiles the information gained through the sensors. This part is shaped like a hourglass in order to insure the positioning in the actual beanie and to prevent movement on the baby’s head. This can all be seen in Image 1.
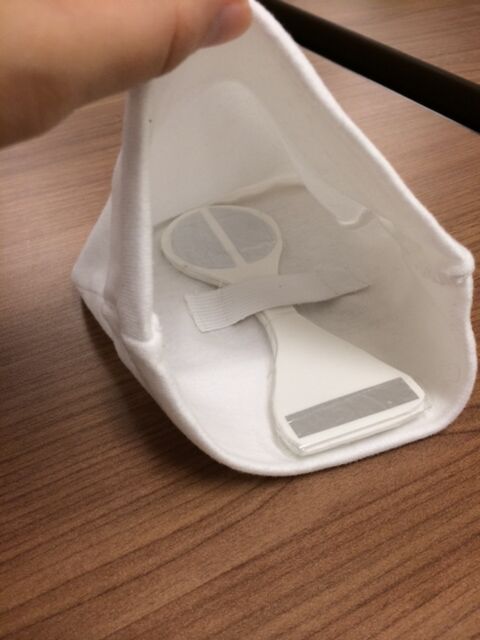
The second part of the Baby Beanie is the actual beanie with a sewn in piece of fabric. This sewn in fabric is used to anchor the monitoring part as previously described. This can be seen in Image 2. Image 1Image 2Inferential StatisticsGraphs |
||||||||||||||||||||||||||||||||||||||||||||||||||||||


