BME100 f2017:Group9 W1030 L3
| Home People Lab Write-Up 1 | Lab Write-Up 2 | Lab Write-Up 3 Lab Write-Up 4 | Lab Write-Up 5 | Lab Write-Up 6 Course Logistics For Instructors Photos Wiki Editing Help | ||||||
|
OUR TEAM
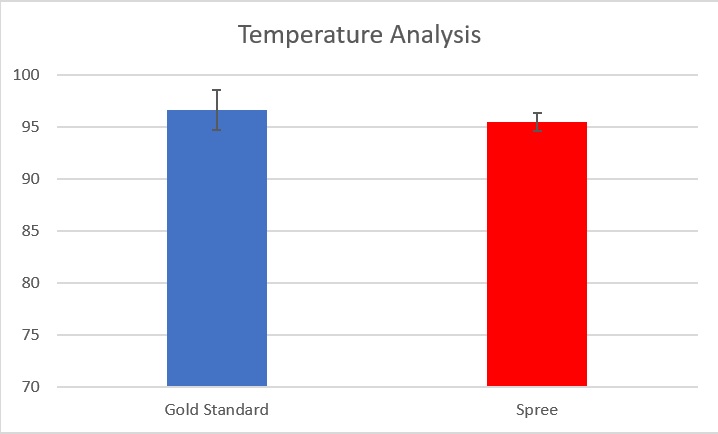
LAB 3 WRITE-UPDescriptive Stats and GraphTemperature -Mean Gold Standard:96.64716049 -Mean Spree:95.5308642 -Standard Deviation Gold Standard:1.922602071 -Standard Deviation Spree:0.870378299
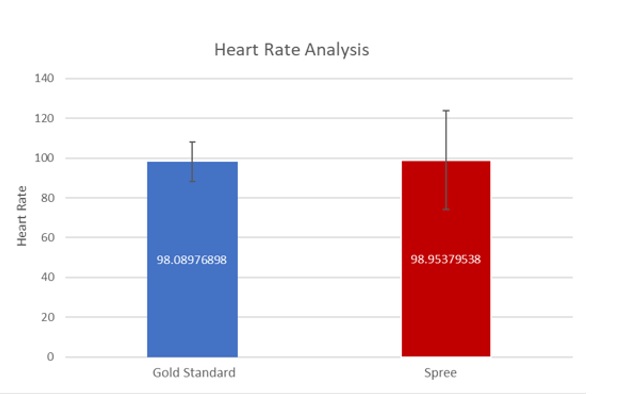
-Mean Gold Standard:98.08976898 -Mean Spree:98.95379538 -Standard Deviation Gold Standard:9.899494937 -Standard Deviation Spree:24.87753802
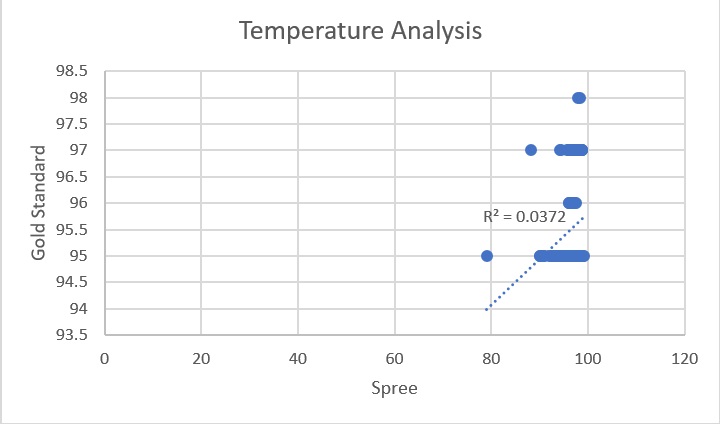
Inferential StatsTemperature -T Test:0 -Pearson's Correlation:0.1927980889
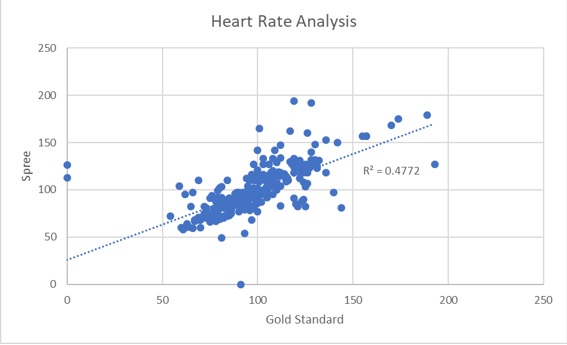
-T Test:0.6574607722 -Pearson's Correlation:0.6908064894
Design Flaws and RecommendationsOver the course of this experiment many conclusions were made. The recorded measurements from the Spree Band were fairly close but not as precise as the values for the gold standards of each measurement. The means of the Spree Band and the gold standard for both temperature and heart rate were within 1.1 degrees and 1.0 beats per minute respectively. The standard deviations of the Spree Band and the gold standard for the temperature were 0.8703782993 and 1.922602071 respectively. Additionally, the standard deviations of the Spree Band and the gold standard for the heart rate were 24.87753802 and 9.899494937 respectively. These values show that when measuring temperature, the Spree Band is more reliable than when measuring heart rate however, neither match up completely to the gold standard. The Pearson’s correlation coefficient for temperature was 0.1927980889 while the coefficient for heart rate was 0.6908064894. Since both of these values did not closely approach +1 yet were still positive numbers, they showed a positive relationship between the two variables, but not a perfect linear relationship. Therefore, the Spree Band can be utilized to measure temperature and heart rate but its effectiveness is questionable when compared to the measurements of the gold standard.
Experimental Design of Own DeviceThe experiment conducted is used to test product success. The total sample size is 100 patients who all contract Alzheimer’s. Half the sample will be a control group and will receive no treatment from the patches, while the other half will receive the patches. The experiment will go over a span of a year. Subjects will undergo a memory based test before the start of the experiment. The subjects will undergo the same memory based test once a month. The scores will be recorded as data. The goal is to see stagnation or improvement in scores. This data will support that the product works. Decrease in scores mean that the product has no effect. The control and test group will be compared to see how much effect the product had on treated patients. | ||||||


