BME100 f2017:Group9 W0800 L6
| Home People Lab Write-Up 1 | Lab Write-Up 2 | Lab Write-Up 3 Lab Write-Up 4 | Lab Write-Up 5 | Lab Write-Up 6 Course Logistics For Instructors Photos Wiki Editing Help | |||||||
|
OUR COMPANY
FluorImager LAB 6 WRITE-UPBayesian StatisticsOverview of the Original Diagnosis System In each team of 6, they are given a set of three for both patient DNA's to diagnose. Our team broke up the workload by having two students perform the experiment by diluting the DNA samples with the PCR reaction mix that had reagents and DNA polymerase. We also had a negative and positive control to reference in the next lab. The positive control contained the known SNP while the negative did not. The test tubes now containing a mixture of DNA and PCR reaction mix were placed into a thermocycler for a few hours. The next lab we began the fluorimeter test. Here we broke off the experiment once again with two people performing the procedures. For the experiment we placed 80 micro-liters of the diluted DNA on top of a hydrophobic glass slide which had a blue laser running through it. We then placed another 80 micro-liters of SYBR green 1 solution to the drop. Using our phone, we took 3 pictures of the drop once covering it with a box.This step was repeated for the rest of the DNA. We also had one droplet of just water to use as another control. With these pictures we analyzed them using Image J and were able to collect our data in this means.
What Bayes Statistics Imply about This Diagnostic Approach
The results for calculations 3 and 4 imply that using PCR for predicting the development of the disease is not very reliable overall, although it is reliable specifically for the describing the specificity of the system regarding the ability to predict the disease, but also not reliable for describing the sensitivity of the system regarding the ability to predict the disease. Calculation 3 shows that the probability that the patient will develop the disease given a positive test conclusion is about 50%, which is not very reliable. However, for calculation 4, which shows the probability that the patient will not develop the disease given a negative final test conclusion, this probability was very high and close to 1.00, which shows that the PCR method is reliable in predicting the diagnosis in its specificity and in negative conclusions. Overall, the calculations imply that the PCR is not very sensitive in predicting the manifestation of the disease, but has high specificity in predicting the manifestation of the disease. Three possible sources of human or machine/device error that could have occurred during the PCR and detection steps that could have affected the Bayes values in a negative way include potential contamination of DNA during the PCR DNA mixture creation process, issues with consistent data analysis of the fluorimeter pictures using ImageJ software, and the issues with micropipetting the right solutions onto the slide for the fluorimeter. In the preparation process for creating the DNA mixtures necessary to successfully undergo PCR, if the micropipette used did not get a new tip for each mixture, then DNA from the previous mixture could have contaminated the DNA, thus potentially creating a false positive or negative result, which would then affect the Bayesian statistical analysis to be less accurate. The ImageJ analysis process was not completely consistent, as when an oval was drawn over the droplet, it may not have been over the maximum area of analysis because it was based on subjectivity of what a person thinks is light or dark. As a result, this may have affected the data that determined whether or not the PCR reaction was positive or negative, thus affecting the Bayesian analysis negatively. Lastly, the micropipetting of the solutions onto the slides for the fluorimeter could have also been an issue, as if the wrong solution was used or diluted incorrectly and analyzed as if it was a different solution and that data was analyzed, then this would affect the PCR reaction results, as this would mean the wrong data was being labeled as the right data. This would affect the Bayesian analysis as there would be a false inconsistency or consistency within the data.
Intro to Computer-Aided Design3D Modeling
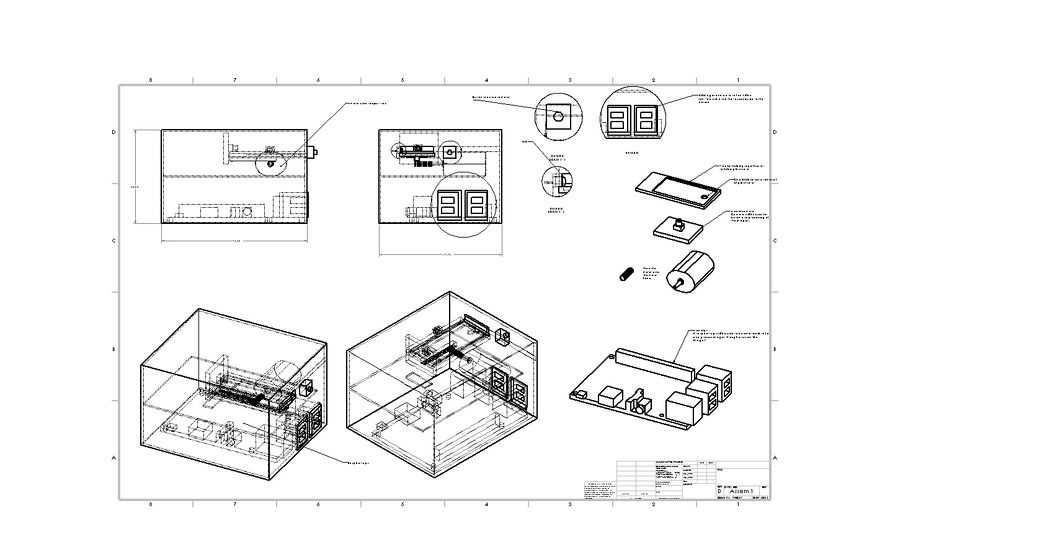
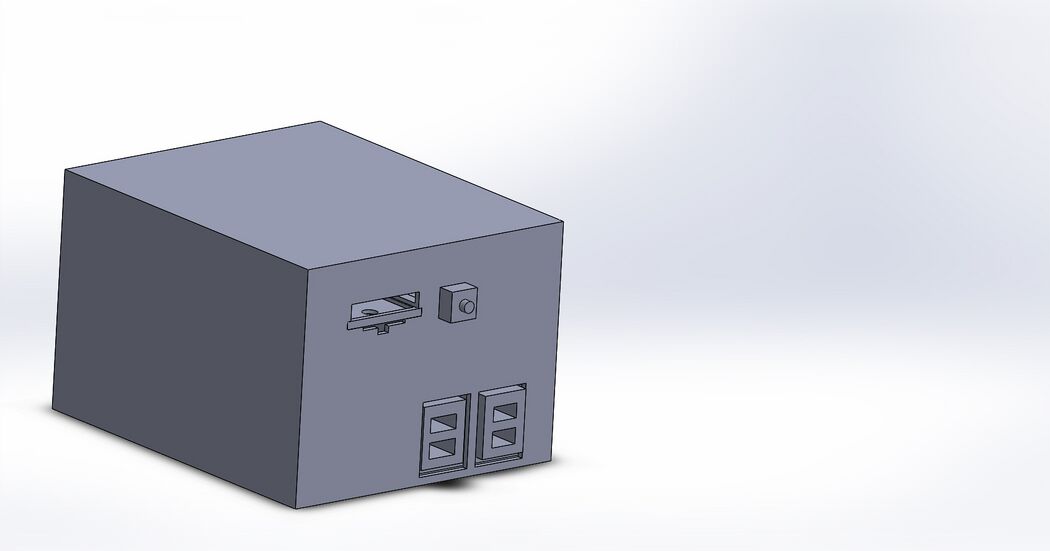
These images are of a new fluorimeter device to be used for the purpose of analyzing pixel density in addition to the usual fluorimeter abilities. This completely enclosed lightbox is designed as to minimize human error when dealing with the fluorimeter system. The added motor assisted tray labelled tray will ensure that the drops will land more consistently on the tray in the same area while the built-in camera will always take a photo in the same area. The pre-built in ImageJ-like software will remove the chance of people taking different area sizes because each area for each drop will be exactly the same area in the exact same place. All of this is being done through the courtesy of a model 1 (A) Raspberry Pi. The OpenPCR design will stay the same, as the hardware altered in our group's product is the fluorimeter.
Feature 1: ConsumablesThe consumables packaged with the PCR and PCR analysis kit will include colored and labelled PCR tubes, liquid reagents including the PCR mix, primer solution, SYBR Green solution and buffer solution in labelled and colored tubes as well, and glass slides. These are necessary and "very important" consumables that must be a part of our group's product and marketed kit because they are either vital to addressing the major weakness targeted in the PCR and PCR analysis procedure, which was human error. The glass slides must be packaged in the kit because they must be a specific size in order to fit the special fluorimeter the group has produced since they must fit the automatically retracting tray in our group's version of the fluorimeter. Not only are the glass slides specially sized, but they will also have a colored circle indicator to illustrate where exactly the droplet of liquid needs to be placed. This is an easy and efficient indication to further prevent more human error. The colored labelled PCR tubes that will be placed in the PCR machine in which the liquid reagents will be mixed together and the colored and labelled tubes of different liquid reagents are also necessary in order to address the major weakness of human error.
The consumables packaging plan addresses the major weakness of human errors in that they seek to minimize the most basic errors that could come from incorrect procedure. The colored and pre-labelled PCR tubes are so that the person conducting the experiment can clearly see what mixes are what and which ones are a part of which group, to minimize error in the pipetting process to reduce contamination between samples, and to reduce error in incorrectly analyzing one data set as something else. The colored and labelled liquid reagent tubes, including the PCR mix, primer solution, SYBR Green solution, and buffer solution address the weakness of human error in the same way, as by having them colored and clearly labelled, the person conducting the experiment can easily tell which reagents are supposed to be mixed and at what step they should be mixed and when to eject and get a new pipette tip. Feature 2: Hardware - PCR Machine & FluorimeterBoth the Open PCR machine and the fluorimeter are still vital to the procedure in which the group has decided to go with. The Open PCR machine will be utilized in the same manner as it was in the original procedure, as it will still be used to conduct the PCR reaction and amplify the DNA target sequence. The fluorimeter is also going to be used after the Open PCR machine is run as well in order to quantitatively analyze the data gathered from PCR. However, the group has decided to redesign the fluorimeter to address the weakness of human error.
| |||||||


