BME100 f2017:Group6 W1030 L6 delete this page

From OpenWetWare
Jump to navigationJump to search
BME 100 Fall 2017 Home
People
Lab Write-Up 1 | Lab Write-Up 2 | Lab Write-Up 3
Lab Write-Up 4 | Lab Write-Up 5 | Lab Write-Up 6
Course Logistics For Instructors
Photos
Wiki Editing Help


OUR COMPANY

Name: Amy Cumiford
Name: Ray Regorgo
Name: Jason Buis

Our Brand Name

LAB 6 WRITE-UP

Bayesian Statistics

Overview of the Original Diagnosis System


Each team was given two patient samples. Three samples of each patient were prepared to undergo the open PCR reaction. Primers, nucleotides, Taq polymerase were added. A positive and negative control were also included. After undergoing the PCR reaction, the samples were ready to be analyzed using a fluorimeter. The DNA was added to separate buffer tubes. Another set of final DNA concentrations (2.5, 1, .5, .25, .125 and a control of 0) were prepared for comparison with the sample DNA. 80 uL of a sample were placed on a hydrophilic glass slide and 80 uL of SBYR Green was added. Then it was lined up with the blue LED light. Three photographs were taken for each sample. To prevent contamination, the next row of dots were used on the slide for each column for the next set of sample to be placed. In the final spreadsheet, the class had no blank data, but there were a number of inconclusive data. This was due to the different outcomes of the same picture. The rest though, were successful conclusions, the data produced similar results, therefore allowing for a reliable conclusion of whether the sample was positive or negative.

What Bayes Statistics Imply about This Diagnostic Approach


Calculation 1 shows the probability of getting a positive final test conclusion given the total positive PCR's. This number was close to 1. Calculation two shows the probability of getting a negative final test conclusion given the total negative PCR's. This number was also close to 1. Since both of these numbers are close to 1 it is concluded that the PCR's ability to detect whether the patient has the disease or not is fairly accurate.


Calculation 3 shows the probability that the person has the disease given that the PCR final test conclusion is positive. This number is close to .5. Calculation 4 shows the probability that the person does not have the disease given that the PCR final test conclusion is negative. This number is close to 1.0. The reliability of the person having the disease given that it is positive can be concluded as not very reliable. However, the probability that the person does not have the disease given that the PCR is negative can be concluded as fairly reliable.


From the very beginning, sources of error could be found during the micropippeting of the samples into the buffer. In the midst of transferring the patient samples, some liquid could have been left over in the tube, affecting the results somehow. Another source of error could be the contamination of the sample by accidentally placing the next set of samples on a section of the slide that has already been used. Thirdly, the SBYR Green could have lost its effectiveness by being exposed too much to the light. During the lab, the tube containing the SBYR green was covered in tin foil, which may not have been sufficient enough to protect the chemical.

Intro to Computer-Aided Design

3D Modeling

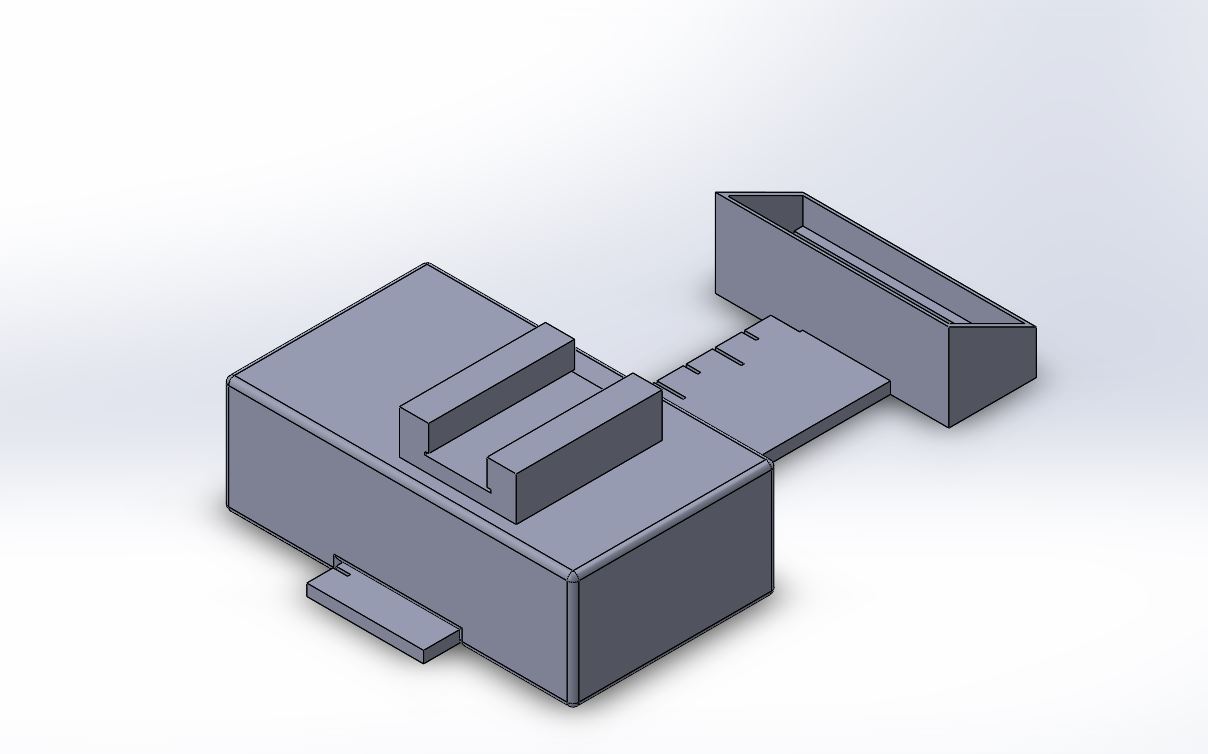
The 3D modeling software that we used was solid works. Solid works is a very powerful software that has the ability to stress test designs and do many advanced features. For our project we only used solid works to create a basic 3D model with one moving part. Solid works has a slight learning curve compared to other 3D modeling software such as auto desk inventor. We also used solid works to creat an assembly file where we combined two parts to creat our final component.


Our Design


We choose this design so there would be a more accurate and consistent method of arranging the phone camera for capturing pictures to use in image J. Our design includes a built in ruler that connects the phone cradle and the slide holder so the phone is always a set distance away from the slide.


Feature 1: Consumables

Our product's consumables kit includes the following standard materials

PCR mix
Primer solution
SYBR Green Solution
Buffer
Tubes (regular size)
Hydrophilic Glass Slides
Pipette tips
Micropipette

Feature 2: Hardware - PCR Machine & Fluorimeter

Our group felt that the current weakness in the PCR machine and fluorimeter were human error using the equipment rather then the equipment and software itself. To improve the fluorimeter we created a more user friendly design to keep measurements consistent. An essential part of any lab is being able to document every single change that is implemented in the experiment. Proper data recording is crucial in any lab. We decided to keep as much of the PCR machine and it's components standard size to keep the cost to a minimum, so everything in the consumable kit is made in standard size.