BME100 f2017:Group6 W0800 L6
| Home People Lab Write-Up 1 | Lab Write-Up 2 | Lab Write-Up 3 Lab Write-Up 4 | Lab Write-Up 5 | Lab Write-Up 6 Course Logistics For Instructors Photos Wiki Editing Help | ||||||
|
OUR COMPANY
Our Brand Name LAB 6 WRITE-UPBayesian StatisticsOverview of the Original Diagnosis System 17 teams of 6 students each diagnosed 34 patients total to determine whether or not the patients' genetic codes contained the disease-associated SNP. To determine the presence of the SNP, the method of PCR was used to amplify the desired portion of the genetic code, then SYBR GREEN 1 was used to provide visible and measurable results. Once the desired portion of the patient's DNA had been amplified and the relative fluorescence had been measured, the results could be compared to a positive control and a negative control, in order to determine whether the patient had the disease-associated SNP. Throughout the experiment, multiple measures were undertaken in order to minimize error. For each patient, there were 3 samples of DNA. This helps minimize error because a greater sample size reduces variability. Likewise, for each bubble three smartphone images were captured to ensure the photo quality was up to standard. Also, the calf-thymus DNA samples were used to calibrate fluorescence detection and thus reduce the possibility of error. To prevent error with regard to the ImageJ calculations, an average value was taken from three different images that all corresponded to the same unique PCR sample. The class's final data for the most part resulted in successful conclusions, however there were a number of inconclusive results as well. These inconclusive results as well as the missing data from Group 11 both contributed to lessening the overall reliability of the disease-associated SNP diagnosis. Overall, the majority of groups yielded negative test results for the presence of the disease-associated SNP in their patients. Challenges encountered during the experiment include: the movement of the smartphone camera from photo to photo, user errors in micropipetting, and leftover residue on the slides from one PCR sample to another. These problems may have affected the accuracy of the class's data. What Bayes Statistics Imply about This Diagnostic Approach Calculation 1 describes the sensitivity of the system regarding the ability to detect the disease SNP. The sensitivity was about 0.8. Calculation 2 describes the specificity of the system regarding the ability to detect the disease SNP. The specificity was close to 1.
Intro to Computer-Aided Design3D Modeling Our Design
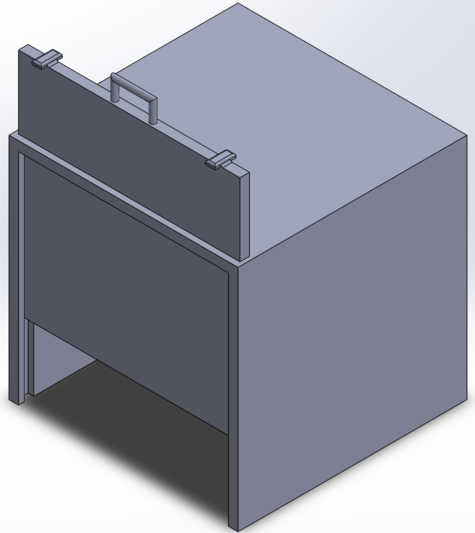
Feature 1: ConsumablesOur edited design of the fluorimeter does not require any additional consumables. The edited design is just an extended stand to keep the smartphone in place and a sliding door to ensure no light enters the system when capturing photos. These design edits do not require consumables.
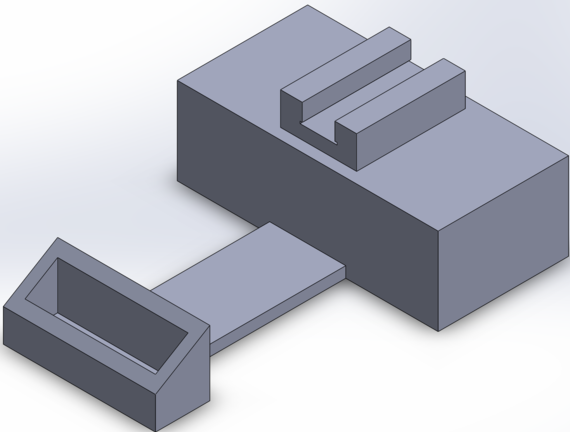
Feature 2: Hardware - PCR Machine & FluorimeterAs a team we decided to focus on redesigning the fluorimeter. One weakness we noticed is that there is a lot of room for error due to the systems separate parts. We came up with a design where the box has an extendable ruler with a phone stand on it. This will allow the phone stand to stay stable and maintain the exact distance away from the tray. Also, to better prevent any light from entering the system, we redesigned the fluorimeter to have a sliding door. Rather than just having a flap, the sliding door will have rivets on the sides of the front face in order for the door to close fully and minimize the light that enters system.
| ||||||


