BME100 f2017:Group5 W0800 L6
| Home People Lab Write-Up 1 | Lab Write-Up 2 | Lab Write-Up 3 Lab Write-Up 4 | Lab Write-Up 5 | Lab Write-Up 6 Course Logistics For Instructors Photos Wiki Editing Help | |||||
|
OUR COMPANY
Lytebox LAB 6 WRITE-UPBayesian StatisticsOverview of the Original Diagnosis System
We had a positive control that contained a template DNA strand with the known SNP, and a negative control that did not contain the known SNP, so the primers would not properly bind. We also had positive and negative controls for our fluorimeter, and used bovine serum albumin concentrations to construct our calibration curve. We took three pictures of each droplet in order to get more reliable results, from averaging. We used ImageJ to analyze our PCR results, which we found by combining a droplet of PCR product with a droplet of Syber green on a fluorimeter, and taking a picture with our phones. Our data analysis went awry, and we had a negatively-sloped calibration curve, so we determined our positive and negative results from the apparent green color observable with the naked eye. When the whole class pooled their data, one group did not submit final conclusions, so we omitted their data when calculating statistics. Each group submitted their positive and negative conclusions for each trial, and their final positive and negative determinations.
The probability that a patient will develop the disease given a final positive test result is about 65%, so the sensitivity of this test is very low. The probability that a patient will not develop the disease given a final negative test result is about 90%, so our specificity is much higher than our sensitivity, but still not conclusive.
One possibility is a failure in primer design, different thermocycler parameters then what normal are, or nonspecific binding to other template sequences. A possibility is that the pictures we took of the reaction could have been blurry, or out of focus in which case the measurements that were given to us from imageJ would be skewed. The micropipetting method could have been incorrect allowing for excess liquid or not enough liquid to fill the micropipette, which in turn would skew the data by filling the test tube with an incorrect amount of substance. Steps that could have affected the Bayes Values in a negative way: Bayes Values can be affected in a negative way by if our test was not sensitive enough and we could not see the green that would indicate if our sample was positive or negative. For example, our first patient we diagnosed as positive, but the doctors diagnosed it as negative. Intro to Computer-Aided Design3D Modeling
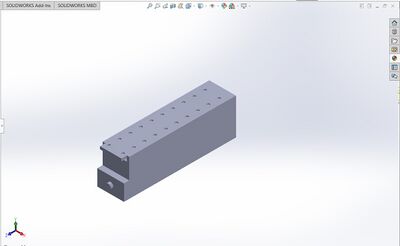
Underside of the box with cameras: Side view of box with cameras: Light stand with slide assembly:
Feature 1: ConsumablesThe only consumable in our product is the slide. After one use, the slide must be cleaned our replaced with a new one.
Feature 2: Hardware - PCR Machine & FluorimeterOur design will use fluorimeter technology, not PCR technology because our product is only designed to improve fluorimetry. We kept the technology in fluorimetry the same, only utilizing a more powerful camera and a box less prone to light contamination. The light attached with the camera will move between loaded sample drops, so the user will not have to load the box for each sample, but will rather load multiple sample and receive the pictures for all loaded samples. All samples will still be loaded the same way, with a drop mixture of SYBR green and DNA loaded into the wells of the glass slide.
| |||||


