BME100 f2017:Group5 W0800 L3
| Home People Lab Write-Up 1 | Lab Write-Up 2 | Lab Write-Up 3 Lab Write-Up 4 | Lab Write-Up 5 | Lab Write-Up 6 Course Logistics For Instructors Photos Wiki Editing Help | ||||||
|
OUR TEAM
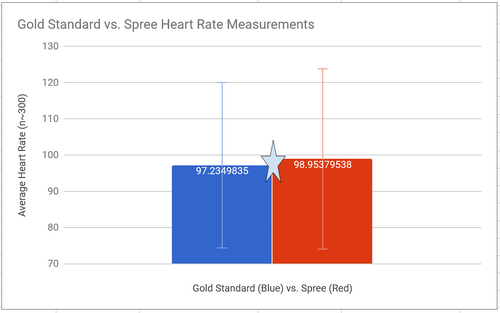
LAB 3 WRITE-UPDescriptive Stats and GraphHeart Rate Mean, GS: 97.235 Mean, Spree: 98.958 STD, GS: 22.837 STD, Spree: 24.878
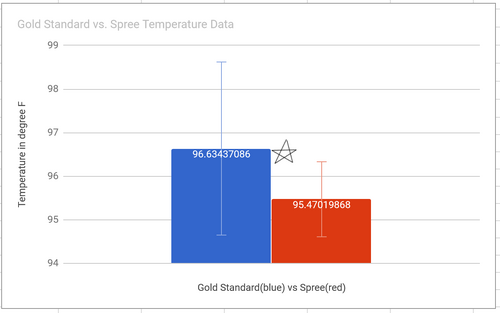
Temperature Mean, GS: 96.63 Mean, Spree: 95.47 STD, GS: 1.99 STD, Spree: 0.86
Inferential Stats and AnalysisHeart Rate Paired, two-tailed T test: 0.0937
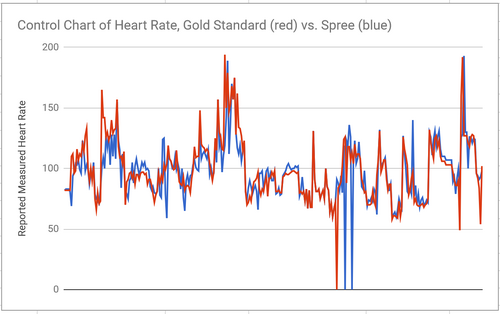
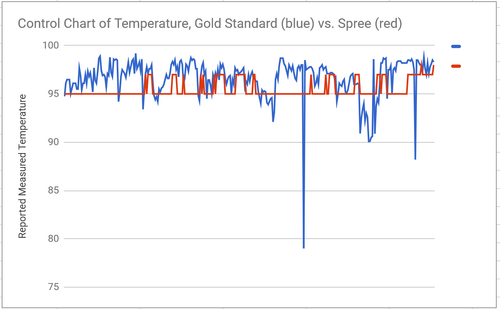
For our heart rate data, the mean of gold standard was 97.23, while the mean for Spree was 98.95 beats per minute. We had about 300 data points for each group. The standard deviations for each group were between 22 and 25 beats per minute (there was a greater standard deviation in heart rate data than in temperature data because our subjects went walking, which increased their heart heart significantly, but not their temperature), so the average and variability of each group was roughly similar. Our 2-tailed T Test (we used 2 tailed since one person was used to test both Gold Standard and Spree technologies) was .0936, which, since it is greater than 0.05, indicates that our groups are not statistically different, which we inferred from the similarities between means and STDs. The Pearson’s coefficient was 0.725, which indicates that our two groups are roughly correlated. The star on the graph shows the similarity between the two groups. On the other hand, for the temperature readings, the mean of the gold standard was 96.63 degrees Fahrenheit, and the Spree’s mean was 95.47. In total, there were 305 data point amongst the groups. The standard deviation for the gold standard data was 1.986, and 0.861 for the Spree data. Our paired, two-tailed test result was so tiny as to be considered 0, which indicates there is significant statistical difference between the gold standard and the Spree for measuring temperature. We found the correlation coefficient to be .19, meaning that there is relatively no correlation between the data in the two groups. Since our subjects' temperature was expected to stay relatively constant throughout the course of the experiment, given the homeostatic capabilities of the human body, we are not surprised that each group had small standard deviations. The Spree does, on average and with significance, return temperature readings lower than the gold standard, so we recommend improve the temperature reading capabilities of the Spree for improved performance. From the control chart we included, it seems as if the Spree automatically reports a temperature reading of 95 degrees, and only sometimes deviates from this. The star on the graph shows that the mean of the gold star data is greater than data points within the first standard deviation of the Spree data.
Experimental Design of Own DeviceTwo separate groups of participants, one with fully functional “healthy” lungs, the other with the infected lungs. The “healthy” participants would make sure that our product did not negatively affect the lungs and cause health problems not intended by our product. Both of the groups will contain 50 people of 5 different age groups. The age groups would be as follows: 18-25, 26-32, 33-40, 41-48, 49-56. Both groups would be tested on original lung capability and a MRI would administered to show the amount of particulate in the lung before the device is used. To test the lungs capability we would measure the amount of air you can breath in and out, the speed at which you can blow air out, and if necessary, we would test how well the lungs deliver oxygen to the blood. These tests include Spirometry and Lung Diffusion. After a dose from the inhaler the same tests would be given to each group in order to measure the improvement or degeneration of the lungs ability to breath air smoothly. The experiment will take place over the course of a month to observe the long and short term effects of treatment. A dose is considered to be one puff of the inhaler every other day until the effect of the inhalant is known. The breathing tests would continue daily to accurately measure the change of ability in the lung. The MRI test as well as the blood test would be administered once per week during the duration of the experiment to observe actual changes in the particular matter in the lungs. This will continue or change accordingly until the symptoms (and problem) disappear. Our P-Test would need to be less than 0.05 because then our confidence level would be 95%. The T-Test would need to be as close to zero as possible, because the further away from zero the more likely that the effect is “statistically significant.” Which means that the effect is not due to random chance-there is an underlying repeatable cause.
| ||||||


