BME100 f2017:Group4 W1030 L6
| Home People Lab Write-Up 1 | Lab Write-Up 2 | Lab Write-Up 3 Lab Write-Up 4 | Lab Write-Up 5 | Lab Write-Up 6 Course Logistics For Instructors Photos Wiki Editing Help | ||||||
|
OUR COMPANY
Our Brand Name LAB 6 WRITE-UPBayesian StatisticsOverview of the Original Diagnosis System The BME 100 Lab tested for patients with the disease-associated SNP by using the methods of PCR and fluorometry. There were 16 teams with 5 people each that diagnosed a total 32 patients. In order to achieve the greatest accuracy possible in the given amount of time, 3 trials were done with each patient. Two controls were done to have a standard to compare the results against. Tips of the micropipette were replaced after every use to avoid cross contamination. 3 pictures were taken of every drop on the fluorometer to ensure that the best possible picture was used for the ImageJ calculations. ImageJ in and of itself was not a difficult process, with the main hurdle being the beginning calibration. We had to gather the area of the oval we created over the droplet, the integrated density, and the mean grey value. Doing this across all of the droplets proved to be a tedious but rewarding process as we received data that would help us draw our conclusions, regarding the actual areas of the droplets that actually reflected the green light. 3 drop images were used per generated number afterwards, allowing us to draw an average value and better understand that specifics drops values. While our results were a bit muddled, whether from calculation errors or quality of image J assessment is unsure, we were unable to draw reasonable conclusions regarding the actual standing of the patients. Another issue we had encountered was varying distances and camera angles to the fluorometer.
The Bayesian Statistics imply that a single PCR reaction is not extremely reliable to determine whether or not a person will develop the disease, as there is only about an 80% chance a positive PCR reaction will lead to a positive final conclusion. However, the statistics imply that the test will somewhat reliably show when a person would not develop the disease, as over 90% of the negative reactions lead to negative final conclusions. Oddly enough, the statistics imply that the final conclusion was also not very reliable to determine if someone will develop the disease, as only around 50% of the people with positive conclusions were diagnosed with the disease SNP. Again, the statistics imply that the PCR process is more reliable to determine someone does not have the disease as close to 100% of the people with negative final conclusions were diagnosed to not have the disease SNP. Human errors in this experiment include misreading the PCR results, which may have lead to a misdiagnosis of the patient; adding insufficient/incorrect materials to the PCR tubes, which also may have lead to misdiagnosing the patient; and if the wrong numbers were inputted into the PCR machine, which most likely would have lead to useless samples and inconclusive test results. Intro to Computer-Aided Design3D Modeling Our team used the program SolidWorks to create these 3D drawings. Two of the team members, Jacob and Quentin, have experience with it. Quentin has completed all of the tutorials and is currently working on his SolidWorks certificate. An Intel engineer taught Jacob how to use it and he has has it for 3 years. Ryan has had a little experience with it. Nazmina and Alexis have no experience with the software. Our Design
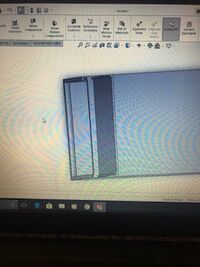
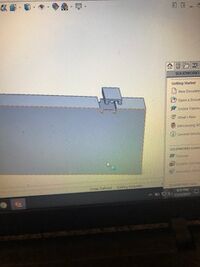
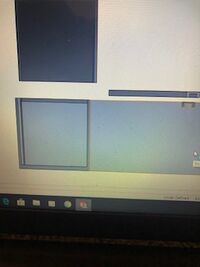
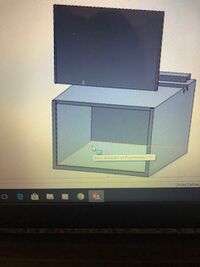
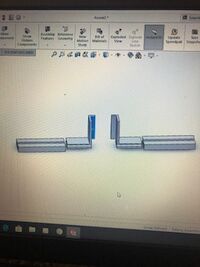
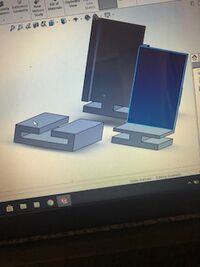
Our group decided to modify the spectrometer box. Our modification achieved two goals, creating a completely dark environment and an improved holding device for phones. For Figures 1.1-1.4, the image shows a completely inclosed box with a solid floor. There is an opening in the front with a specially fitted panel which allows the panel to quickly be slid down to ensure a dark environment. There is an opening on the top with another corresponding panel which allows for easy access to the actual fluorometer. This allows the slide and dye-solution to be replaced without moving the actual device. This keeps distance constant and eliminates a source of error. Figures 2.1-2.2 show a device that is designed to hold any size or shape phone. The actual device is built into the floor of figure 1.4. Both sides are spring loaded which will allow the two towers to move along their track and provide even supporting pressure on either side. The towers are L-shaped to proved more stability for the phone as well as having a reference point to place the phone flat against. This holds distance constant and also ensure the phone is viewing the fluorimeter at a straight angle. We chose this design to fix some of our main sources of error so that other will not make the same mistakes. It is more sturdy and takes less set-up than the original open PCR design. It is different in the ways described above.
Feature 1: ConsumablesOur kit will contain the newly designed spectrometer box, the original OpenPCR machine, 100 200microliter tubes, 100 mL of SYBR Green dye. This dye will allow the fluorometer to take its readings. Any additional SYBR Green dye or 200 microliter tubes may be purchased from our company as well. Feature 2: Hardware - PCR Machine & FluorimeterOur new system will include the original OpenPCR machine and our newly designed spectrometer box. The box (referenced in the previous section) addresses the issues of a non-perfect zero-light environment and the issue of distance. The new design ensures the distance is held constant between the fluorometer and the phone. It also allows any kind of phone to be used to take the pictures.
| ||||||


