BME100 f2017:Group3 W1030 L6
| Home People Lab Write-Up 1 | Lab Write-Up 2 | Lab Write-Up 3 Lab Write-Up 4 | Lab Write-Up 5 | Lab Write-Up 6 Course Logistics For Instructors Photos Wiki Editing Help | ||||||||
|
OUR COMPANY
Pandora's Boxes Inc. LAB 6 WRITE-UPBayesian StatisticsOverview of the Original Diagnosis System To determine which patients had disease-associated SNP's, BME100 groups creatd PCR reactions for their two patients. The first part of the experiment was taking the patient DNA samples and creating PCR samples out of them for testing. Once the PCR samples were created, they were placed into buffer to add volume and each group began testing their samples. To minimize error, when extracting the DNA or placing the PCR samples into the buffer, each group had to make sure no bubbles were created or not enough fluid was gathered when using the micropipette. As long as each group watched the instruction video, there shouldn't have been any issues with the micropipette. In group three, the labor was divided up with two members working on the physical experiment while two other members worked on the calculations. Other groups most likely did a division of labor along those lines because in order to get the experiment done in time, the physical experiment and calculations had to be done simultaneously. When it came to getting the pictures for the ImageJ calculations, each group used the fluorimeter and smartphone to gather data. To prevent error, group three used three of the pictures taken with the burst photo setting in order to minimize bleaching of the solution. Other groups may have just taken three sets of pictures, it didn't matter too much because it would have effected every picture taken. An oval was overlaid over the droplet in ImageJ and brightness was compared between each image in order to conclude if the patient was positive for disease or not. The final class results showed varying levels of positive and negative results that either lead to a conclusive result or an inconclusive result, but for the most part each group was able to make an accurate judgement. The inconclusive result could have come out of error in the experiment or a lack of data to make an accurate conclusion. What Bayes Statistics Imply about This Diagnostic Approach Calculation 1 gives the probability that a patient will get a positive final given a positive PCR reaction. Since this probability is close to 1, this shows that there is high sensitivity when predicting whether or not the patient has the disease SNP. Calculation 2 is the probability that a patient will get a negative final test conclusion given a negative PCR reaction. Since this number is close to 1, there is high specificity when predicting whether or not the patient has the disease SNP. Overall, this shows the individual PCR replicates are reliable for concluding whether or not the patient has the disease SNP because they are high in both specificity and sensitivity. Calculation 3 is the probability that a patient will develop a disease given a positive final test conclusion. Since this probability is close to 50%, this shows a low sensitivity when detecting the disease SNP. Calculation 4 is the probability that a patient will not develop the disease given a negative final test conclusion. Since this probability is close to 1, it shows a high specificity when detecting the disease SNP. Overall, this shows that the reliability of the PCR is questionable because the sensitivity is low which would cause false negatives, but the specificity is high. Possible Sources of Error Firstly, the droplets could have appeared as different sizes due to the changing of camera position and angles. Second, when measuring the area of the droplet, the oval may have not been consistent across all of the tests. Finally, during the process of transferring data to the documents, data points could have become mixed up, causing outliers to appear. Intro to Computer-Aided Design3D Modeling
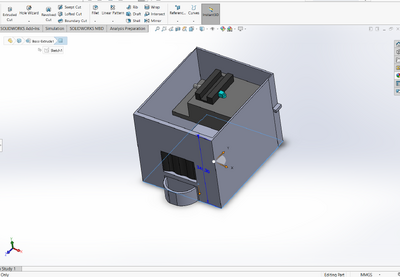
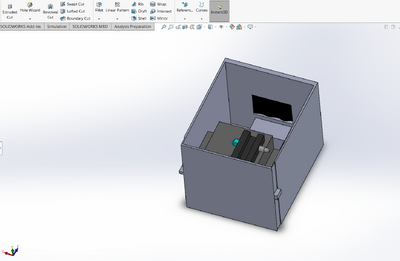
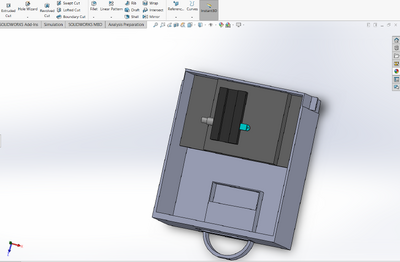
Feature 1: ConsumablesWhen deciding on which consumables to include in the new package, it was determined that it was important to only include the consumables that were reagents because they are necessary for the PCR reactions. Therefore, the consumables included in the new package are 400 microliters of PCR mix, 400 microliters of the primer solution, 2,000 microliters of SYBR Green I solution, and 8 tubes of buffer with 500 microliters each. The other materials, such as the micropipettor, the micropipettor tips, glass slides, and plastic tubes, will have to be purchased separately by the consumer because these are not included in the kit. It was decided to not include these in the final package because a large amount of plastic tubes and micropipettor tips are consumed when doing a PCR reaction and varies depending on how many samples are being tested. Therefore, it is difficult to determine how many of these consumables to include in the kit. Feature 2: Hardware - PCR Machine & FluorimeterAs the use of the PCR machine by the class was limited to just one lab, our experience with the device was not extensive enough to allow the students to come into contact with any number of glaring or tangibly significant flaws with the design, in either the hardware or software department. As such, the PCR machine seemed perfectly functional, so it made much more sense to instead work on improving the Fluorimeter. Therefore, the PCR machine will remain the same in both its original design and its uses. The Fluorimeter was used as a means of determining the intensity of the concentration of DNA in a droplet sample. The group decided it would be best to modify the fluorimeter system because it proved to be the most problematic component of the PCR test. The new design improves upon the following major weaknesses: difficulty in setting up the camera, inconsistent photos, and the failure of the fluorimeter box in fully blocking out the light. To make the camera easier to set up, the phone cradle was made taller in order to hold the phone better. Additionally, the cradle is attached to the inside of the box so it can easily slide forward and backward to adjust for the distance between the camera and the droplet. To remedy the issue of inconsistent photos, the smartphone cradle can now lock into place so that the distance between the camera and the droplet does not change between each photo. Lastly, instead of having a whole side of the box lift up to take the photo, there is now a hand-sized hole in the side of the fluorimeter box to allow easy access to the camera button on the smartphone. The hole is covered by a black out curtain so that no light is allowed inside the box while the pictures are taken. This solves the problem of light getting into the box by ensuring that the fluorimeter environment is pitch black when the smartphone is taking photos. Also, for convenience, instead of having to stack the fluorimeter on plastic boxes to reach the proper height of the camera, an adjustable shelf that can move up and down and can lock into place was added to the inside of the box for the fluorimeter to sit on.
| ||||||||


