BME100 f2017:Group13 W0800 L3
| Home People Lab Write-Up 1 | Lab Write-Up 2 | Lab Write-Up 3 Lab Write-Up 4 | Lab Write-Up 5 | Lab Write-Up 6 Course Logistics For Instructors Photos Wiki Editing Help | |||||||
|
OUR TEAM
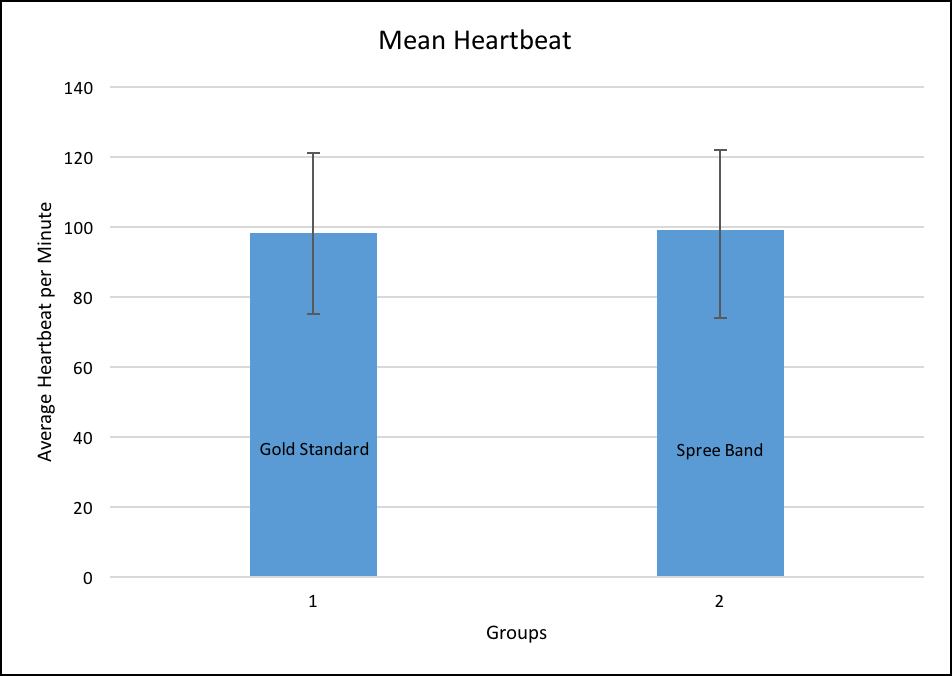
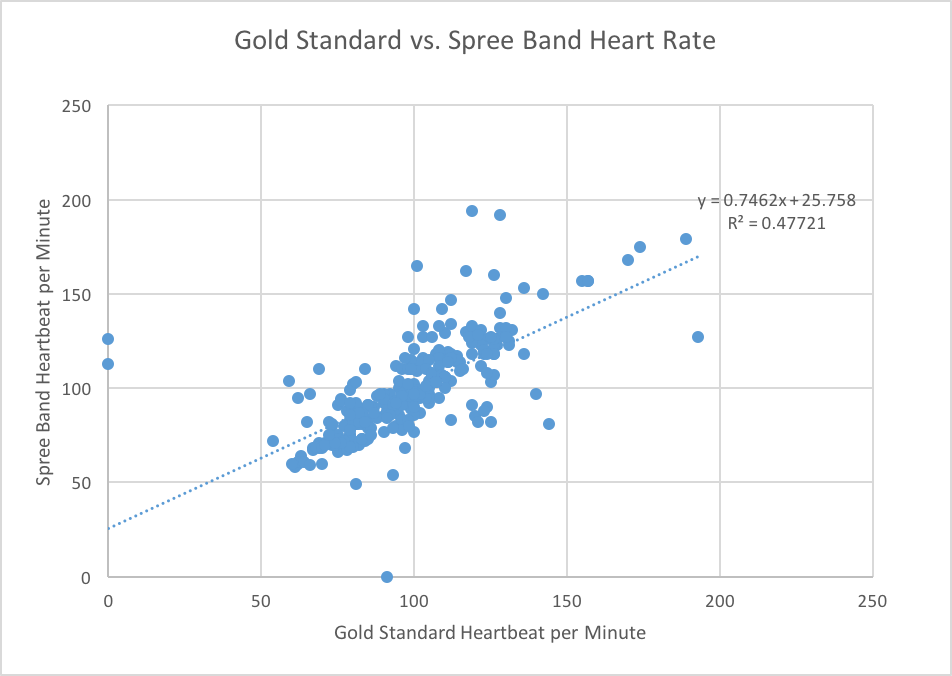
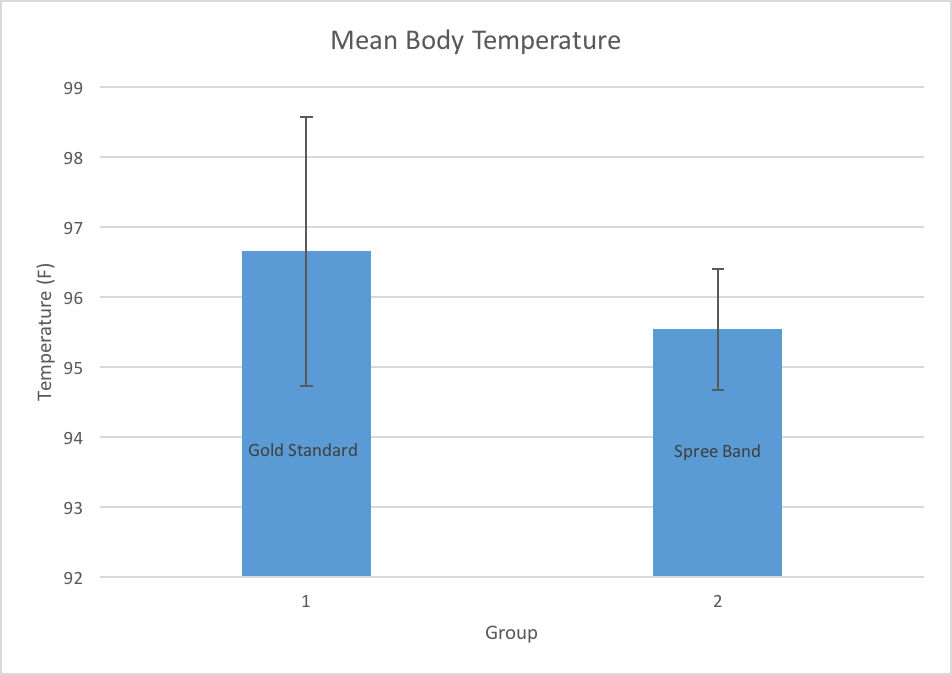
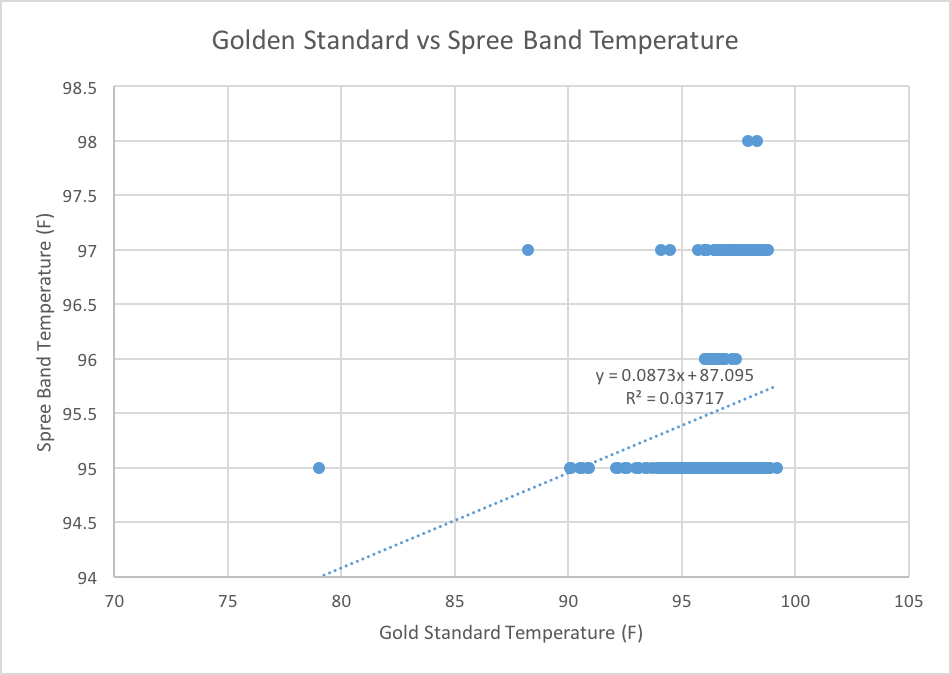
LAB 3 WRITE-UPDescriptive Stats and GraphHeart Rate: Pulse Ox (Gold Standard) Mean: 98.0898 Spree Band Mean: 98.9540 Pulse Ox (Gold Standard) Standard Deviation: 23.0305 Spree Band Standard Deviation: 24.8775 Pearson "r" Value: 0.6908 Body Temperature Oral Thermometer (Gold Standard) Mean: 96.6472 Spree Band Mean: 95.5309 Oral Thermometer (Gold Standard) Standard Deviation: 1.9226 Spree Band Standard Deviation: 0.8704 Pearson "r" Value: 0.1928 Inferential StatsHeart Rate: T-Test Value: 0.4271 Pearson "r" Value: 0.6908 Body Temperature: T-Test Value: 1.0968 E-21 Pearson "r" Value: 0.1928
Design Flaws and RecommendationsSince the Pearson’s Correlation value is 0.6908 for heart rate, there is a strong correlation between the Spree band measurements and the golden standard measurements. However, since the t-test value is at 0.4271, it also means that the experiment is likely to produce different results if it were to be performed again. In summary, the Spree band is good enough to approximate heart rate, but would need additional testing with a larger sample size. Since the Pearson’s Correlation value is 0.1928 for body temperature, there is a weak correlation between the Spree band measurements and the golden standard measurements. Although the t-test value of 1.0968 E-21 shows that the results are highly reproducible, the Spree band lacks the ability to accurately measure body temperature. This can only be improved by changing the sensors in the device.
Experimental Design of Own DeviceThe purpose of this experiment is to test the effectiveness of our prototype in providing relief for back pain and posture correction. Our prototype is Kinesio tape that is strategically cut to provide lumbar support, correct posture, as well as the option of cooling or heat packs for additional pain relief. A group of 500 people with back pain issues will be selected for the experiment. The experimental group will consist of half of the subjects will be selected at random. They will wear our product for a month. The other half will be the control group, who will wear normal KT tape to treat back pain. All participants will take the Oswestry Back Pain Disability Questionnaire before they test out products [1]. The questionnaire assesses the severity of each participant’s back pain and provides a numerical value that indicates their pain level. The participants will first test out the KT tape applied by medical professionals for five days and be asked to fill out the Questionnaire with regard to their pain level while wearing the KT tape. The participant will also fill out the Assessment listed below. The participant will also fill out the Questionnaire and Assessment after trying the prototype for five days. The scores from the questionnaire from before and after the trials will be used to observe whether the prototype had a significant effect on the improvement of back pain. The pain score after using the KT tape will be subtracted from the initial pain score and this value will be used as the “gold standard” for how much back pain was improved. This value will be referred to as Value A. The pain score after using the prototype will be subtracted from the initial pain score and this value will determine whether the prototype is effective in back pain relief. This value will be referred to as Value B. The mean of all of Values A and Values B will be calculated as well as the standard deviation. The Pearson r value can also be calculated. With inferential statistics, the t-test can be done to find the p-value and determine whether the effectiveness of the prototype is comparable to KT tape applied by a medical professional. If the p-value is greater than 0.05, then Values A and Values B are not statistically significant and the prototype has comparable effectiveness in relieving back pain as KT tape. If the p-value is less than 0.05, the prototype is not comparable in effectiveness.
How would you describe your level of pain? 1. Significantly less 2. Less 3. Slightly less 4. No effect 5. Slightly worse 6. Worse 7. Significantly worse
1. Increased ability to move 2. Little to no effect 3. Absolutely no effect 4. The device restricts my movement 5. It hurts worse to move now than it did before
1. Significantly better 2. Better 3. Slightly better 4. No effect 5. Slightly worse 6. Worse 7. Significantly worse
Are there any issues with the product? _______________________________
| |||||||


