BME100 f2017:Group12 W0800 L6
| Home People Lab Write-Up 1 | Lab Write-Up 2 | Lab Write-Up 3 Lab Write-Up 4 | Lab Write-Up 5 | Lab Write-Up 6 Course Logistics For Instructors Photos Wiki Editing Help | ||||||||||||||||||||||||||||||||||||||||||||||||||||||||||||||||||
|
OUR COMPANY
Company Name: Whole in the Box LAB 6 WRITE-UPBayesian StatisticsOverview of the Original Diagnosis System This semester our BME 100 lab tested patients for a disease-associated SNP. We had a total of 15 lab groups that tested 2 patients each for a total of 30 patients. The experiment has multiple facets but our group divided the labor into two parts; half of our group obtained images of our fluorimeter results and the other half did ImageJ analysis of aforementioned images. The experiment revolved around using ImageJ to quantify the amount of fluorescence from each sample’s fluorimeter results. The amount of fluorescence would guide our decision on whether the sample had the disease-associated SNP. The design of the experiment in addition to the our division of labor both contributed to our error prevention. We had multiple trained members conduct each part of the experiment to create a system of checks. There were three samples tested of each patient’s DNA, which resolved contradictions and struck a balance between reliability and speed. In addition, there were both a negative and positive control for comparison. Finally, there was 3 pictures taken for analysis of each fluorimeter result. Having multiple trials and comparisons at each step decreased the chance of a confounding variable skewing results and increased our accuracy. A practical benefit of our experimental design came through ease in conducting the experiment. We had multiple ears verifying instruction from TA, professors, and the workbook. In addition, we had additional resources for checking parts of the experiment we thought were suspicious or coming to a decision on unexpected occurrences that we didn’t have to divert from the individual conducting the experiment, cutting down on distraction and possible error. The high standard was reflected in the experimental data. The class came to a conclusion on 26 of the 30 patient results. Of the 4 results that were inconclusive, half were as a result of lack of submission of data rather than issues with the experiment itself. Overall, the original system had specificities above 80%.
CALCULATION 2: Probability Patient gets Negative Final Test Conclusion given a Negative PCR Reaction
CALCULATION 3: Probability Patient will Develop Disease Given a Positive Final Test Conclusion
CALCULATION 4: Probability Patient will not Develop Disease given a Negative Final Test Conclusion
The results for calculations 3 and 4 suggest that using this diagnostic approach is fairly reliable in predicting disease outbreak based on the test’s conclusion. These two calculations reflect the system’s reliability in predicting the disease. Since calculation 3 is for positive conclusions, this calculation reflects disease rate if the disease SNP is present and calculation 2 is for negative conclusions and reflects health rate if the disease SNP is not present. Calculation 3 is slightly above 50%, while calculation 4 is around 90% leading us to conclude this diagnostic approach is fairly reliable and our system gives more false negatives than false positives. Some possible errors that could have affected our Bayes values negatively include imprecise equipment, changing environmental conditions, and nonstandardized analysis. The class used the cameras available to their group, so phone cameras were used with a wide range of models and sensitivities. A standardized camera with a high resolution would do much for increasing the precision of our results and possibly the accuracy. Each group learned how to do ImageJ analysis from the workbook. However, there may have been a difference from group to group in physical judgment since observation with the naked eye is subjective and prone to human error. Lastly, we all conducted our experiments in different parts of the room that was only semi-evenly lighted with different standards for camera and fluorimeter placement, so that could have skewed results as well. Of course, these three errors all compounded each other which exacerbated the problem. Intro to Computer-Aided Design3D Modeling Our Design
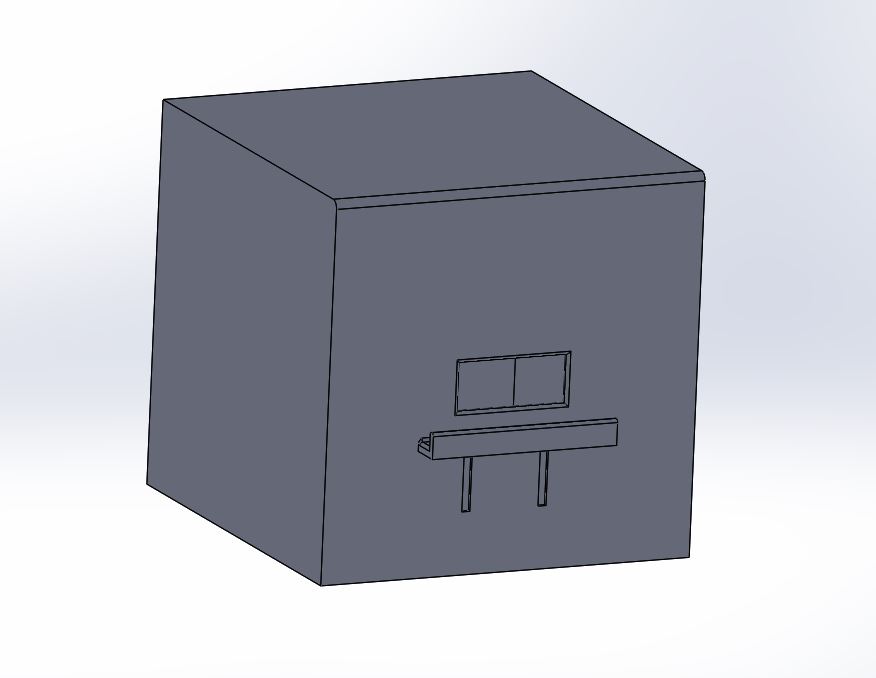
For our improved design, we decided to focus on the fluorimeter stage of the PCR analysis process. In order to improve the current fluorimeter used in the lab, we added the following components-
This design improves upon the current one by limiting light within the fluorimeter (by having the fully close-able front flap with the access opening for photos), and by making the cell phone photo process easier by providing a shelf for stability of the camera. This adjustable shelf (for use with different sized phones) also improves fluorimeter quality by making repeated photos in the same place possible. We chose these design improvements because these problems were the ones mainly encountered by our team when going through the OpenPCR and fluorimeter process.
Feature 1: ConsumablesOur PCR kit would contain the typically consumables required for conducting a PCR. This includes micropipette and micropipette tips, colored PCR tubes, glass slides, a buffer solution, SYBR Green solution, and gloves. Micropipette and Micropipette tips Feature 2: Hardware - PCR Machine & FluorimeterThe PCR machine provided by ASU was used in lab to amplify the DNA samples that we had. PCR tubes containing our samples were placed in the machine and the top lid containing a hot plate was closed. The machine was then programmed so that the temperatures changed at the correct times and the cycle repeated 25 times in total. This process allowed the simulation of the environment required for DNA replication. At the end, our PCR tubes contained a large concentration of DNA and we had to dilute it for the next part. We then made use of the Fluorimeter system provided by ASU to analyze our samples along with a positive and negative control. The Fluorimeter system was simply comprised of a black box with a front flap opening and box to put our glass slides on. We systematically added a droplet of a sample and a droplet of dye such that they would converge to form one bubble on the glass slide. The glass slide box was then placed inside the black box so that the excess lighting was removed. We used a smartphone to take a photo of the combined droplet while it was inside the black box and then transported that photo to a computer. We then used ImageJ to analyze the droplet and graph our results. Lastly, we drew conclusions from the data using Bayesian statistics. The strengths of the PCR machine include that it is relatively fast and it accurately produced our samples. We did not redesign any features in the PCR machine. However, the fluorimeter system had some design flaws. We observed that it was tedious to constantly adjust the position of the phone to take photos and there was also some light that still reached the slides. To fix these issues we designed a black box that had a premade hole where the phone would fit and adjustable positions for smaller or bigger phones. This made it so that the phone did not have to be moved around constantly and less light would reach the slide since the opening in the box is smaller. Thus we made use of the same overall process as before to amplify and analyze our samples but we used a modified version of the black box to make the process more accurate, efficient, and accessible.
| ||||||||||||||||||||||||||||||||||||||||||||||||||||||||||||||||||


