BME100 f2017:Group11 W0800 L6
| Home People Lab Write-Up 1 | Lab Write-Up 2 | Lab Write-Up 3 Lab Write-Up 4 | Lab Write-Up 5 | Lab Write-Up 6 Course Logistics For Instructors Photos Wiki Editing Help | ||||||||||||||||||||||||||||||||||||||||||||||||||||||||||||||||||
|
OUR COMPANY
Our Brand Name LAB 6 WRITE-UPBayesian StatisticsWhat is the probability that a patient will get a positive final test conclusion, given a positive PCR reaction? P(A|B) = P(B|A) *P(A) / P(B)
Overview of the Original Diagnosis System There were 17 groups in BME 100, each of which tested two patient samples for the disease. This gives a total of 34 patients tested. In order to minimized errors and conclude the most accurate results, each group tested 3 samples of each patient's DNA, the results of which were averaged to minimize error. Each group also tested positive and negative control samples, which were used to further groups' understanding of their results, increasing the reliability of the data collected. Another way in which errors were minimized was through the use of ImageJ to calculate the precise coloring of each image taken of the samples. This decreased error by taking away the qualitative human aspect of determining color of the sample images. For example, what one group thinks is a darker blue my in fact be the opposite of what a different group believes. ImageJ takes a more mathematical approach. BME 100 students found that a good majority of patients' results were negative, with a few positive test results and some tests which were "inconclusive." An "inconclusive" result means that some lab error caused both positive and negative results for a patient. In conclusion, the lab test results were primarily negative.
Using bayesian statistics is beneficial to find the reliability of PCR reactions with their ability to detect disease SNPs along with accurately predicting the probability a patient will develop a disease. The results from our bayesian statistics gave that both the negative and positive conclusions are both close to 1. Due to the fact both are close to 1, it can be inferred that a PCR test is capable of detecting disease SNPs. For the third calculation, the probability that the disease will develop in a positive test was a little over 50%. This can be an indicator that the PCR reactions was less reliable when it came to the positive test conclusions. However, the results of the negative test conclusions were close to 1, at about 80%. There results indicate that false positives will be more common than false negatives. One possible source of human error is that the iPhone camera that was used to take the pictures didn't have the option to change the specs to what was listed in the workbook. Another source of human error is that when transferring the solution from the pipette to the slide, not all of it would make it into a uniform bubble. Also, because of the fact the iPhone was not stable in one area, it made the distance of each picture taken slightly different. Intro to Computer-Aided Design3D Modeling Our Design
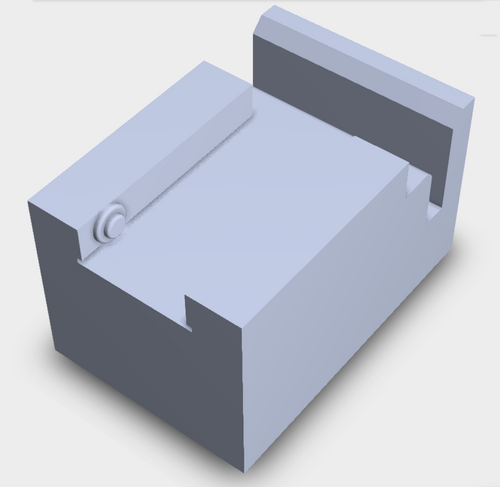
Our design includes a space for the smartphone to be slid into, allowing for more consistency between each image taken. For the slides, we included a space that would allow for the sample to be placed a consistent distance away. These features both address the problems our team had with keeping images consistent with accurate results.
Feature 1: ConsumablesFor our kit, we will include separate packages for different parts of the lab. This includes a set for PCR and a set for analysis afterward. Our expectation is that general equipment, such as glass slides, pipets, pipet tips, and Kimwipes, are all already ordered and ready for lab use, and will thus be included in "Feature 2" rather than this section, for the sake of the lab. For PCR as well, it is assumed that a thermocycler will already be owned by the lab ordering our kits, so only the consumables required for the lab will be included. The kit for PCR will come with supplies to be used with a standard thermocycler. Colored, heat-stable PCR tubes are included for organization and even heating of the sample. Instead of individual solutions, a single mixture consisting of TAQ polymerase, the dNTPs, oligos, buffer, and magnesium ions will be included, ready for a DNA sample to be mixed together and amplified. Each kit will be created on a per-primer basis, with common primers being listed for quick access. The kit for analysis is designed around our improved analysis device. This kit will include SYBR green to color our sample for both qualitative and quantitative data. Glass slides will also be included as a reusable mounting point for the droplets being analyzed.
PCR Kit - Ready-made PCR mixture with specific primers - Colored PCR tubes Analysis Kit - Glass slides - SYBR Green Feature 2: Hardware - PCR Machine & FluorimeterOur team decided to utilize the OpenPCR machine but design our own fluorimeter. This new fluorimeter will still take a smartphone camera and keep each image a consistent distance away from the sample. This way, the camera app will have enough distance to focus on the sample, while still maintaining enough of the sample in the frame to be analyzed in ImageJ later. Our major weaknesses in the original design of the fluorimeter were consistency between images and keeping a focus on the sample, both of which we aimed to fix in our design. | ||||||||||||||||||||||||||||||||||||||||||||||||||||||||||||||||||


