BME100 f2017:Group10 W1030 L6
| Home People Lab Write-Up 1 | Lab Write-Up 2 | Lab Write-Up 3 Lab Write-Up 4 | Lab Write-Up 5 | Lab Write-Up 6 Course Logistics For Instructors Photos Wiki Editing Help | ||||||
|
OUR COMPANY
Our Brand Name DNA ANALYZERSLAB 6 WRITE-UPBayesian StatisticsOverview of the Original Diagnosis System In the BME100 Lab, sixteen teams of five students diagnosed two patients each (32 patients total) by using methods commonly used such as PCR and fluorimetry. For each patient three DNA replicates were used to analyse multiple trials and to insure accuracy. A positive PCR control and a negative PCR control were also examined to compare a standard to the DNA samples. Furthermore, during the fluorimeter process, three photos of each of the six samples as well as multiple calibration tests were taken to minimize error. Each sample was mixed with a SYBR green solution that would illuminate green when tested positive. The tip of the micropipette were disposed of each time it was used to minimize the possibility of cross contamination. Although utilizing the micropipette increased our accuracy, the process of fixing a 160 nanoliter drop of the sample on the fluorimeter strip proved to be a tedious process because the droplet would occasionally shift to a contaminated spot. This also implies that using the micropipette did not completely remove the previous sample. Remnants of the previous sample may have contaminated or affected the following sample. Furthermore, using ImageJ to calculate the area, density, and the mean grey value for each drop was not a difficult process. Overall, the class results showed that there were 17 positive conclusions, and 13 negative conclusions from the 32 DNA test results. In total, there were 56 positive PCR results and 39 negative results out of the 96. From the class spreadsheet, it can be seen that the probability of getting positive PCR test, given a positive control tests was .875 or 87.5%. The probability of getting a negative PCR tests given a negative control test was roughly about .923 or 92.3%. For the diagnosis data, there were 11 out of the 17 positive conclusions that were diagnosed ‘yes’ and 10 out of 13 negative conclusions were diagnosed ‘no’. Only one result was diagnosed inconclusive.
Both the probability that a patient will develop the disease given a positive final test conclusion and the probability a patient will not develop the disease given a negative final test conclusion describe the the reliability of PCR for predicting the development of the disease. Both values are approximately 70% (close to 0.70) implying that there is still a relatively large chance that the PCR test conclusion will inaccurately predict the diagnosis.
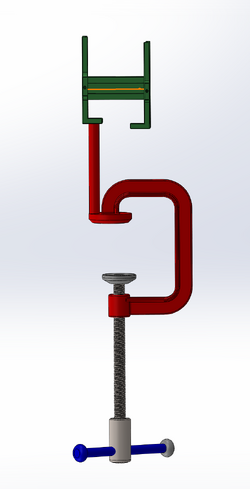
Being that this lab incorporated a great deal of meticulous techniques, there is no doubt that even the smallest of mistakes were inevitable. The first source of error could have come from the misplacement of the camera half way through the picture taking process thus slightly altering the angle and possibly giving a different reading on imageJ. Secondly, error could have also originated from a miscommunication between the group members while transferring the pictures from the phone taking the pictures to the computer used to post them. It is not entirely certain, however it is completely possible that a group of pictures could have been mixed into the wrong order thus skewing the results even more. Lastly, the most generic source of error could have came from the wet lab portion using the pipets in the incorrect way with the incorrect volume being dialed in. Intro to Computer-Aided Design3D Modeling When choosing a specific software to properly showcase a new concept or product it is extremely vital to use the correct one that efficiently highlights the abilities of the designer as well as the product itself. For this reasoning, Solidworks, a well known three dimensional designer program, was used to bring the groups vision to a visual creation. While a very complex program, the group was rather familiar with Solidworks having worked with the program for previous projects in the course. Solidworks also had a plethora of assistive tools in the form of videos that could be used whenever an issue arose. If operated properly, Solidworks can truly create a clean, neat, finished design within a short period of time. Overall the decision was Solidworks due to its familiarity and smooth interface. There were small issues that came about, specifically with rounded edges in the design. However these were resolved through either a professor's guidance or an online source. All in all, our personal experience with Solidworks proved to be smooth. Our Design
Feature 1: ConsumablesThe consumables that will be packaged within our PCR kit includes various mixtures of PCR mixes, primer solutions, buffer, and standard sized PCR tubes. To handle and transfer the various solutions, a pipettor will as be included within the kit. The pipettor will come with an add-on to convert it into a multichannel pipettor. With this add-on it will decrease the amount of time necessary whist pipetting. Feature 2: Hardware - PCR Machine & FluorimeterMany of the potential weaknesses of the Open PCR machine have already been addressed in the current model. When looking at the effectiveness of the machine, the heating/cooling component becomes the most important aspect because the PCR reaction depends on thermocycling. The OpenPCR machine heats the lid covering the PCR tubes. The lid is heated to prevent condensation in the tubes themselves (effecting concentration) and to ensure uniform temperature. The machine uses a heat sink and fan to constantly remove and circulate heat. Thus, the temperature in the OpenPCR can transition within 2 seconds. While the entire process still takes hours in the current model, it is very cost effective. For these reasons, we chose not to modify the OpenPCR machine in our system.
| ||||||


