BME100 f2016:Group9 W1030AM L6
| Home People Lab Write-Up 1 | Lab Write-Up 2 | Lab Write-Up 3 Lab Write-Up 4 | Lab Write-Up 5 | Lab Write-Up 6 Course Logistics For Instructors Photos Wiki Editing Help | ||||||
|
OUR COMPANY
Our Brand Name LAB 6 Pimp my FluorimeterBayesian StatisticsOverview of the Original Diagnosis System In the lab, 73 students splitted into 15 groups to examine 30 patients using PCR method. The PCR results from the experiment yielded a huge percentage difference from the gold standard. The possible sources of error might be false readings from the fluorimeter and image J. During the lab, the distance between the fluorimeter and the smartphone was not as constant as people expected. The actual distance fluctuated each trial. So if the camera could be placed at a fixed position, the result would be much more accurate. Also, some students encountered difficulties when they processed their images using image J. The auto fit ellipse for the drop might not be the best fit for every single image. One possible improvement would be increasing the number of drop images for each condition and fit the image multiple times to ensure accuracy. According to the results collected during the lab, 7 out of 26 patients had positive conclusion while 16 had negative conclusion. And the gold standard which is the doctor’s diagnosis gave 7 yeses and 19 nos. And by comparing the results given by two methods, 3 patients were diagnosed as having the disease and had positive conclusion while 13 patients had no from the doctor and also had negative conclusion. The class generated 3 inconclusive results and 4 blank datas. For our group particularly, we successfully identified one patient with positive result and one with negative result. However, when we submitted our final conclusion, the ID of the two patients got switched which made our conclusion inconsistent with the gold standard.
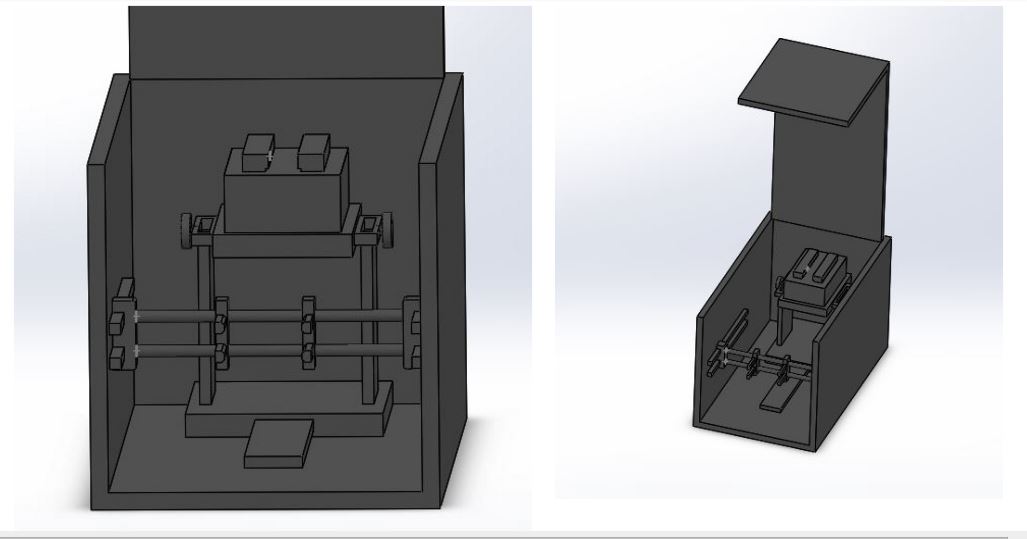
Intro to Computer-Aided Design3D Modeling The software we chose to use in the 3-D modeling portion of the lab was Solidworks, because it provided us with more options and freedom to design. Although TinkerCAD is easier to use, it is limiting, and because the majority of the group had taken BME 182: Product Design and Development, we felt comfortable using solidworks as a team. We enjoyed the program, and felt that there are more than enough online tutorials as well as how-to-guides that can point one in the correct direction when designing or redesigning a product. Although some group members were more experienced with the software, the whole team put in effort to design the product on paper before it was implemented into the CAD software.
Our Design
Feature 1: ConsumablesIt was identified that the greatest error in the experiment came from the fluorimeter calculations, thus we focused our changes to the fluorimetry part of the experiment, and kept the consumables the same. The same tubes containing the buffer liquid, SYBR green solution, water, and the Calf Thymus DNA will be used. The same tube rack will be used to hold the tubes, as well as the micropipetter with the pipetting tips. Although the process of using new pipett tips is wasteful, it is necessary because it provides the user with accuracy. It can be a tedious process, but it is quite simple, and systematic thus minimalizing error and cross contamination. Feature 2: Hardware - PCR Machine & FluorimeterAfter conducting a needs assessment, we realized that both the PCR machine and the Fluorimeter can be improved, but the Fluorimeter was where all the errors were stemming from. Thus, we came to the conclusion that it would be best to keep the Open PCR machine and all the consumables unchanged, and focus on changing the Fluorimeter. When conducting the Fluorimetry test, we saw a couple problems with the procedure. First was setting up the phone was a hassle because the stand provided could easily be moved around while the experiment was being conducted. This would lead to skewed results, because the camera would be out of focus, and the readings on Image J would not be accurate. Secondly, the process of opening and closing the lid, and making sure no light would enter the “zone” was quite primitive. This opening and closing also led to the risk of jostling the phone and slide which contained the DNA sample.
| ||||||


